Introduction:
Healthcare is one of the largest and most frustratingly opaque industries in the United States. Whether it’s the incredible pricing disparities or the labyrinth of rules that health insurers feature — nothing makes sense. At this point, transparency is an unrealistic expectation and consumers are left to largely seek out answers and information for themselves.
Doug Hirsch discovered this more than a decade ago. Even with health insurance, Hirsch was charged $450 for a medication at the counter. When he declined to pay and sought out another pharmacy in the same town, the second price was just $200. There was no explanation, just sympathy on the ridiculousness of U.S. Healthcare.
Ten years later, Hirsch’s realization has now blossomed into GoodRx — a company determined to optimize the American Healthcare system for access and low cost rather than confusion. The journey started with prescriptions but GoodRx has since addressed several other industry pain points to transform into so much more.
1. Understanding Pharmacy Issues
The viability of GoodRx’s core prescription business is rooted in the complexity of drug pricing. To understand this system is to understand the vast utility that the company features. Pharmaceutical reimbursement in the United States is byzantine and I will take the next section to fully describe it. If you don’t require those details, skip to section 2 or the summary chart at the end of section 1.
a. The Manufacturer’s and Wholesaler’s Roles:
Drug manufacturers set the initial price in the prescription work flow which is referred to as the list price. This list price is what a consumer would pay without any insurance or other discount programs.
A manufacturer conducts business with two types of entities: wholesalers and Pharmaceutical Benefits Managers (PBMs). Manufacturers are typically paid by wholesalers serving as a supply-side middleman between these producers and the actual pharmacy. 3 wholesalers account for 90% of the U.S. market today and so pharmacy chains benefit from maintaining fewer relationships with wholesalers vs. hundreds with different manufacturers.
Wholesalers use their immense scale to purchase large quantities of product at a time, thus granting them bargaining power to buy the medicines at a slightly discounted price. The price that a manufacturer charges the wholesaler is referred to as the average manufacturer price (AMP). The wholesaler will then sell the drug to pharmacies at a slightly marked-up rate.
When working with PBMs, manufacturers pay a rebate whenever a PBM creates incremental demand. This essentially functions as a hidden commission for access to the PBM’s membership network.
b. The Pharmacy Benefit Manager’s Role:
A PBM mainly works on behalf of insurance companies and large employers to negotiate pricing concessions with pharmacies. Generally speaking, they manage the drug perks an insurer can offer to their members — hence the title Benefits Manager.
These PBMs create value by aggregating all available insurer networks to create leverage with pharmacies and thus to lower prices. The pharmacies enjoy juiced demand (albeit with lower margins) via PBM-sponsored copays being lower than the Usual and Customary (U&C) price (also referred to as the “cash price”). Pharmacies also benefit from the inherent cross-selling that the added foot traffic brings.
Usual and Customary (U&C) price defined: The price that a consumer with no insurance or other discount program is charged at the pharmacy counter. This is also referred to as the “cash price.”
When a PBM fosters a pharmacy sale, it charges the associated insurer what is called the Maximum Allowable Cost (MAC) — this is merely the term for the highest drug price allowed by the PBM. The PBM — acting as a middleman — then uses these funds to compensate the pharmacy for dispensing the drug — but not by the same amount. Instead, PBMs will pay the pharmacy the lower negotiated rate and pocket the spread.
The spread defined: Funds collected by a PBM from an insurer - proceeds paid to the pharmacy for dispensing a drug
To give an idea of how crazy this pricing process truly is, PBMs often charge payers 5-20x more than what they’re paying the pharmacy for dispensing. There are even frequent instances when the PBM is paid a large fee by an insurer without even having to pay the pharmacy a cent.
It’s good to be a benefits manager — and it gets even better:
PBMs grade pharmacies on outcome data and claw back a portion of reimbursements if those grades are not satisfactory. These are called renumeration fees. The issue here is that variables such as adherence are used in the grading process which pharmacies have 0 control over. An even more ironic piece of this equation is that adherence suffers from higher drug prices and PBMs are a root cause of these higher prices as we’ll see in section 1c below. The vast majority of pharmacies have reported having to pay back PBMs in the form of these remuneration fees.
The benefits managers also directly work with drug manufacturers. A drug manufacturer pays PBMs for two things: to recommend their medication vs. close substitutes and, secondly, to negotiate lower prescription copays to financially incentivize purchasing. Essentially, manufacturers pay PBMs a commission to create incremental demand. The commission payment is what I called the rebate above and is shared with the insurer.
This brings us to our first conflict of interest. PBMs are not encouraging their networks of insured lives to take the best, most affordable and more effective medications. PBMs are nudging consumers towards whichever drug has a manufacturer willing to pay the highest kick-back fees.
Outrage within drug price structuring is typically directed towards the pharmacy, but perhaps that should be refocused onto PBMs. Yes, these PBMs serve a positive role in lowering out-of-pocket costs for insured lives — but the negatives are bountiful as well.
c. The Pharmacy’s Role:
The pharmacy pays the wholesaler for prescription supply and gets compensation from the insurer (through the PBM) and the covered consumer. Together these two parties pay roughly the U&C price for the prescription. The insurer’s payment is called a “reimbursement” with the patient’s fee referred to as the “co-pay” or “co-insurance.” Pharmacies charge the full U&C price to uninsured patients.
The negotiated rate that an insured American will pay depends on the bargaining power of the PBM, the pharmacy chain and manufacturers. Because this power violently varies, so do drug prices for all Americans.
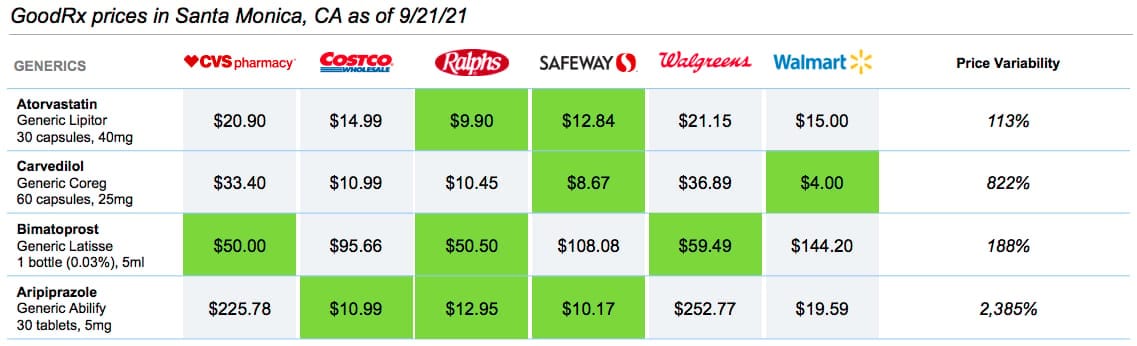
The maximum a PBM will ever reimburse a pharmacy for dispersal is the U&C (AKA cash) price. Because of this, a pharmacy will often set the cash price far above the estimated maximum reimbursement to ensure that the business is not missing out on any revenue. For example, if a pharmacy sets a U&C price of $5 but the PBMs maximum willingness to reimburse was $10, the pharmacy is only compensated $5. If the cash price is set at any number over $10.00 the pharmacy gets double the reimbursement.
In reality, the pharmacies do not know the maximum willingness to reimburse from PBMs so they are left to guess at which U&C price will be above that amount. The large chains that own a PBM (like CVS) have direct access to one PBM pricing point — but just one of many.
Furthermore, rising negotiating power from consolidating PBMs has placed downward pressure on the portion of the total fee a that the pharmacy collects. Pharmacies have a fixed cost per medication dispersal of roughly $11 meaning any reimbursement below this amount results in a loss on the transaction. To compensate for the profit margin headwinds, pharmacies commonly inflate the U&C price even further and charge people without PBM representation even more.
This brings us to our next innate conflict of interest. The scenario laid out above inherently incentivizes the rapid growth of U&C pricing, and the uninsured are the people actually paying this U&C number on their own. Translation? The most financially vulnerable population in our nation is footing the bill and this is exactly where the high-profile issue of lofty drug prices for the uninsured stems.
The effect is hauntingly negative. According to the American Journal of Health-System Pharmacy, every 4 minutes an American dies from not taking a medication as directed with nearly 30% of scripts left at the counter mainly due to cost. This is an urgent issue.
Regardless of widely-ranging, inflated costs, most medications are non-discretionary purchases. This means price elasticity of demand is extremely low and consumers have no alternative but to foot the bill. Even for insured individuals, the combination of sharply rising copays and deductibles as well as massive price ranges creates an environment of inefficient drug costs for most Americans.
d. The Insurance (Carrier/Provider/Payer) Company’s Role:
The actual insurance company is the primary payer when a medication is dispensed from a pharmacy to a covered individual. These insurance providers pay the PBM which will then pay the pharmacy a portion of the bill when an insured customer goes to buy a drug. A key question is, how can PBMs get away with charging the deep-pocketed insurers in excess of what these PBMs pay the pharmacy? How does the spread (defined above) exist?
A few things to consider. First, PBMs are not required to disclose the specific terms of their spread and rebate contracts. This reality has created an environment lacking any form of transparency and has allowed PBMs grow their profits precipitously over the decades at the expense of other parties.
Insurance companies also have other priorities beyond prescriptions. PBMs eliminate a great deal of administrative headache by handling the reimbursement of dispensed drugs — this frees insurers to focus elsewhere on higher return on investment (ROI) endeavors. Insurance companies once did all of this pricing negotiation and reimbursement directly. In recent decades — however — the ambition to expand medication coverage proved to be too overwhelming to handle internally for most carriers.
The providers benefit from the superior bargaining power that a PBM’s larger overall network brings. PBMs are simply in an ideal position to focus here and negotiate better pricing as the top 3 — Caremark, Express Scripts and OptomRx — control 75%+ of the overall market. Without PBMs, payers lose this valuable, membership-boosting ally as virtually no insurance company can match the aggregated scale that benefits managers provide.
Don’t feel bad for insurance companies. Carriers benefit from rebate sharing and the largest 3 PBMs are also all owned by large public insurers. These providers are actively choosing to pay their integrated PBMs the maximum allowable cost (MAC) rather than the negotiated pharmacy price because it’s a good business decision.
The PBM business model is inherently more profitable than insurance payers — it’s not even close either. PBM spreads have only grown further with this vertical integration, and that is because favoring PBM operations at the expense of insurance profits is a net positive for payers. Insurers are not incentivized to fix some of the root causes of sky-high prices, but are instead encouraged (somewhat forced, really) to add gasoline to this fire.
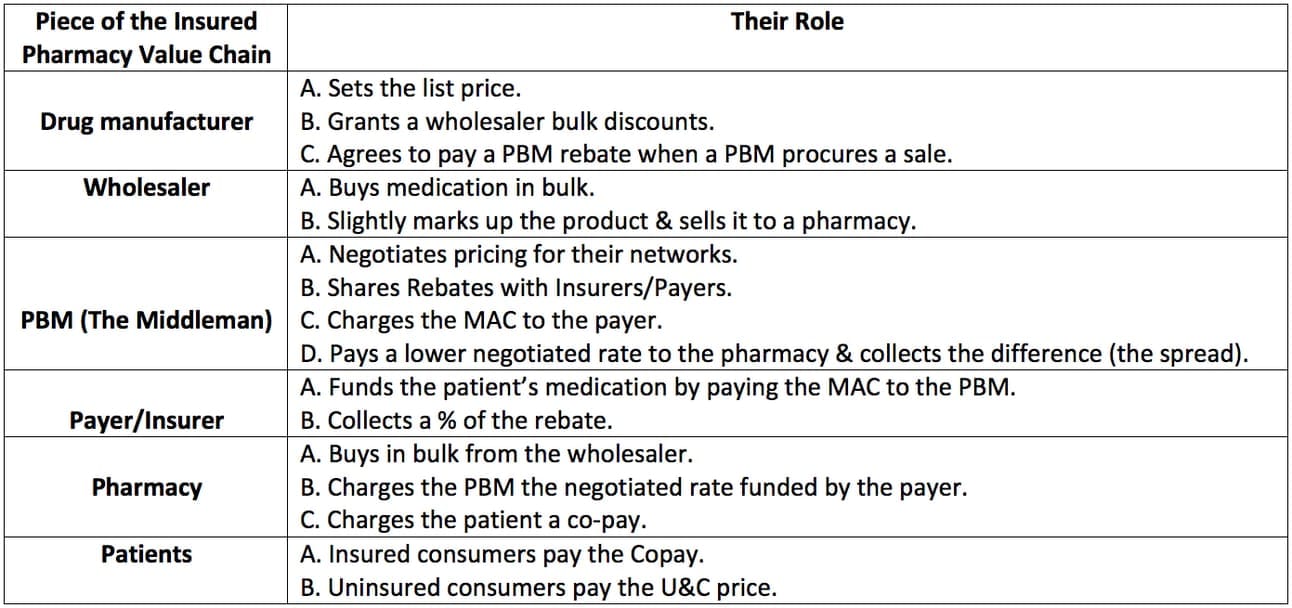
f. Summary of the Value Chain and Role of Each Party:
2. More Problems with Healthcare
a. Higher Costs Yet Worse Outcomes:
Intense cost pressures and poor outcomes in American Healthcare are not unique to the pharmacy value chain — far from it. GoodRx’s product suite is not merely focused on prescription discounts, but on healthcare overall — and for very good reason.
Americans rank last in life expectancy, obesity and chronic disease among nations within the Organization for Economic Cooperation and Development (OECD). Despite this grave reality, the United States spends roughly 2X per capita on healthcare compared to these same OECD nations according to Lancet. This is not a matter of resources, it’s a matter of allocation, incentives and organization.
Despite Americans having on average just $1,000 in savings, health insurance premiums and co-pays cost the average family $5,000 annually per the Bureau of Labor Statistics. That number is just for insured Americans — the uninsured have it far worse.
We also have to consider the current challenge of U.S. insurers and employers pushing more and more of the financial healthcare cost burden onto members and employees. Trends such as higher deductibles and larger co-pays are creating a new class of “underinsured” individuals who still can’t afford quality healthcare despite having coverage.
Per the Kaiser Family Foundation, the average deductible for covered Americans rose 36% to $1,655 from 2014 to the beginning of the pandemic. This means individuals are responsible for 36% more cost before the insurer will step in to help. Rising deductibles have paved the way for a new type of insurance called “high deductible health plans” (HDHP) with 30% of insured employees enrolled in this type of coverage as of last year vs. 8% in 2009.
Other sources like Health System Tracker have data pointing to average deductibles quadrupling to $1,2000 from 2006 to 2016. The exact growth in out-of-pocket costs varies by data source but the idea that these costs are growing is uncontested. As we will see later, this change has vastly grown GoodRx’s targetable market.
While there are affordability options out there for consumers, these options (other than GoodRx’s) are difficult to find and even more difficult to navigate. Fragmented pricing silos and restrictive regulation across healthcare lead to massive cost variances that consumers should be able to take advantage of. In reality, most aren’t able to do so thanks to the sheer complexity and inaccessibility of the industry.
I can go online to find the best deal on a concert ticket, but I can’t do so when trying to access life-altering care. With no context on pricing or service scores, it becomes impossible to judge one option vs. another and leads Americas to have to accept whatever their reality may be. That’s an issue.
b. Access and Inefficiency
While cost and complexity are severe hurdles for consumers navigating American Healthcare, access is as well. Shockingly, 25% of Americans do not have a primary care physician and 64% of Americans have delayed care due to affordable access. Furthermore — via data published by Teladoc Health — 80% of working age adults lack a strong relationship with a primary care physician. Bringing this 80% down to 0% would cut overall U.S. Healthcare costs by 20-25% (or over $800 billion) — but this is difficult to do. Why?
Our nation has a real doctor shortage with average wait time for a new appointment in the USA of 56 days in some markets according to Merritt Hawkins. Early detection is our specie’s best way to fight disease — these long waits preclude that early detection from taking place.
The results? 30% of emergency room (ER) visits in the United States can be avoided with better access to primary care in non-emergency settings. Based on UnitedHealthcare data stating that the average ER visit costs $2,200 in America, this is a pressing issue. In total, unnecessary ER visits cost the United States $300 billion per year according to the New England Journal of Medicine. These expenses are often born by U.S. health systems as well with 66% of all personal bankruptcies being healthcare related per the American Journal of Public Health.
Better access can work wonders in fighting these battles, but our nation has been struggling to improve healthcare outcomes for generations. As I will explain in detail, GoodRx’s product suite is uniquely and perfectly tailored to combat this harsh reality.
This isn’t just an issue for patients, but doctors as well. We have to remember that physicians are mainly graded on their track records of outcomes and efficacy. All of these issues prevent many Americans from pursuing the best healthcare options — that serves as a tangible headwind in the way of physicians enjoying successful careers.
The issues for doctors continue. Legacy electronic health record (EHR) and filing systems do not offer healthcare professionals with specific information of individual patient costs. This means physicians often prescribe medications and services without being able to understand patient affordability. This reality innately lowers adherence overall.
U.S. Healthcare has left countless people behind with that actuality only becoming more true in recent decades. That’s exactly where GoodRx helps. The company’s north star is to provide actionable healthcare solutions for the rapidly growing cohort of underserved Americans and it’s finding admirable success in doing so.
3. GoodRx Product Primer (The Philosophy)
GoodRx aims to aggregate all of the healthcare pain points we’ve covered to generate less frustration, better outcomes, healthier lives and more successful doctors. It works to uplift every stakeholder in the healthcare journey through an inherently direct-to-consumer (DTC) approach. This ambitious vision started with a price comparison tool for mainly generic drugs but has since blossomed into so much more.
It fixates on rounding up the countless disparate data sources existing in healthcare and transforming these sources into easy-to-understand language and pricing. Its combination of fostering superior access to information and a focus on an intuitive user interface (UI) equips consumers with the power to effortlessly take healthcare into their own hands. That’s the essence of GoodRx.
The company’s goal is to be with the consumer for every step of their healthcare journey to build trust, delight and loyalty. This way, when an American decides that they need to seek care, they inherently think about doing so through GoodRx.
4. GoodRx’s Core Prescription Price Comparison Product
a. How This Works:
GoodRx’s largest (and first) product is its prescription price discounting tool. This product takes pricing information from across the industry — mainly from PBMs — and translates dozens of intricate cost-calculation methods to offer consumers a centralized location for prescription deal comparison. Like most cutting edge companies, GoodRX leans on machine learning (ML) to minimize clicks and confusion per action and thus to reduce user friction whenever possible.
Users can access the GoodRx app, pick the best price and present the coinciding GoodRx pricing code at the participating pharmacy for deep discounts off of the original U&C price — no insurance necessary. Once a code is selected and used, it’s automatically stored in a pharmacy’s database for future medication fills. GoodRx collects a commission from the related PBM every time its code is used leading to high-margin, high-visibility revenues.
For the rare instance of a consumer being displeased with the service, the company’s patient advocacy team features a 99% satisfaction rate with average wait time to get a representative of 20 seconds.
GoodRx works with over a dozen PBMs in total and not one has ever left the company’s platform with more signing on virtually every quarter. That makes perfect sense when we look more closely:
PBMs aggregate most of their bargaining power and collect most of their revenue through relationships with insurers and employers. Virtually every PBM — however — also has a direct to consumer cash business operated independently from the insurance value chain. The deals offered through these consumer-facing businesses make up the majority of the prices GoodRx offers its consumers. Insurers play no part in the fulfillment process when GoodRx is involved. Instead, Pharmacies pay PBMs a fill fee whenever a PBM pricing point is used and when that pricing point is originally accessed through GoodRx’s platform the PBM and GoodRx split the fee.
“We believe that we maintain the largest database of aggregated pricing information across PBMs in the United States.” — CFO Karsten Voermann
Even if a PBM were to leave the platform, the value it provides its partners is so compelling that GoodRx’s contracts allow it to collect fees after contract termination if GoodRx was originally responsible for the sale. An unparalleled PBM network featuring 230 billion daily pricing points paired with GoodRx’s top of mind brand awareness foster the best discounts in the industry. Furthermore, it also gives GoodRx a large supply of first party data to drive more relevant product upgrades and utility enhancements.
GoodRx signs 2 types of contracts with PBMs. 93% of this segment’s revenue comes from contracts structured so that GoodRx collects a set percentage of the fill fee. This fee structure is generally tiered with more volume being rewarded with a higher take rate for GoodRx. The remaining 7% of this revenue comes from contracts calling for a fixed fee for each sale that the firm is responsible for procuring.
b. The Results and User Base:
As of GoodRx’s most recent quarter, this product’s average prescription savings rate rose from 79% to 80% off of U&C prices. This 80% compares to 71% at the time of its IPO last year and 56% in 2016. Virtually every single script in GoodRx’s database now yields at least 70% savings off of the U&C price. Overall, the product has saved Americans over $35 billion on their prescriptions vs. “over $20 billion” when GoodRx went public in 2020.
“We dominantly have better pricing that anyone else in the discount space and we are the largest player by single digit integers.” — CFO Karsten Voermann
Intuitively, this price advantage leads to GoodRx users being roughly 60% more likely to adhere to prescription schedules than the average American. Additionally, 81% of GoodRx consumers can afford all of their medications vs. just 23% without it and the company has allowed 18 million incremental Americans to afford their medications. Talk about a tangible impact. The platform is constantly adding new pricing points to its ecosystem to ensure continuously improving discounts for consumers.
That trend of improving pricing has continued as GoodRx grows its PBM scale and datapoint network. This pricing progress lends itself to a wildly compelling network effect. Better prices further juice volumes for GoodRx and its PBMs which attracts new PBMs. This process also allows existing benefits partners to negotiate better pricing with pharmacies thanks to the volume boost for their operations. Both of these factors place even more downward pressure on pricing to feed the GoodRx growth engine.
GoodRx’s app has been the most downloaded medical app on both Apple and Google for the last 3 years and sports a lofty 4.8 star mean rating with over 800,000 reviews. Repeat activity has been over 80% for the last 5 years and GoodRx’s net promoter score (NPS) for consumers sits at an elite +90 vs. +40 for United Health and +64 for a cult-brand like Netflix. Clearly consumers love the product.
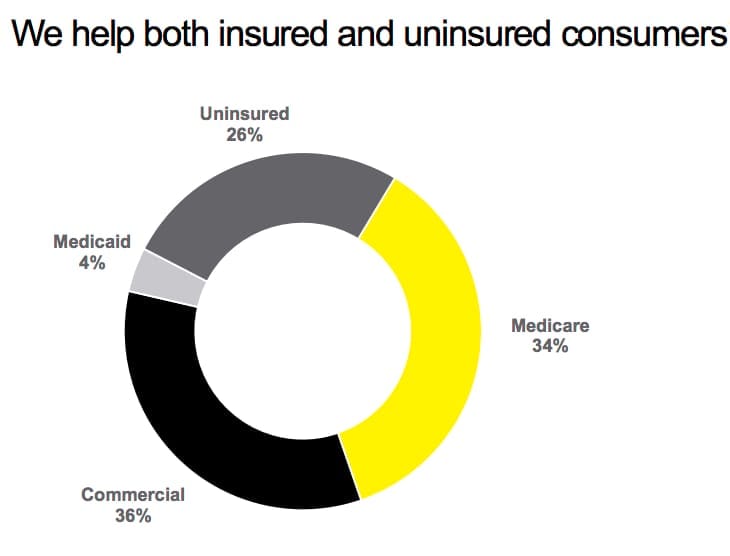
This tool is not just for the uninsured — far from it. The issues of rising out-of-pocket costs has created an environment where the prices GoodRx provides are often better than an insurance co-pay. Specifically, GoodRx is cheaper than insurance copays 55% the time with savings rates of 52% on average in those instances. As a result, 74% of this product’s monthly active consumers (MACs) have insurance; it’s safe to say the target market is most Americans.
c. Why PBMs Choose to Integrate with GoodRx:
PBMs do not collect manufacturer rebates when conducting a sale through cash networks — but the unit economics here are still outrageously compelling. As briefly mentioned, the PBM collects a fulfillment fee from the involved pharmacy in exchange for procuring new cash-pay demand. This fee is then shared with GoodRx. This transaction coincides with virtually zero costs for PBMs as the cash businesses are merely a leveraging of the existing networks that these benefits managers have built through insurers. This means the sales here are almost pure margin and the volume that GoodRx provides is nearly all incremental.
Considering this, PBMs are happy to list their prices on the platform in exchange for paying GoodRx a commission when it generates a sale for the PBM and pharmacy. GoodRx features tens of millions of highly relevant consumers and offering lower prices to far more consumers simply means more volume and more cash flow for PBMs. PBM success doesn’t depend on the price of a sale but instead on more transactions taking place to collect as many low-cost fill fees as possible.
We also have to consider that the more volume a PBM is responsible for, the more power it has to negotiate lower rates with pharmacies to drive more success for its entire business. This added negotiation power doesn’t just help PBMs within the cash business but ALL pieces of their operations by becoming bigger and more influential. GoodRx accelerates and enhances PBM aggregation efforts thanks to the massive volume boost it fosters.
Perhaps as a result, its PBM take rate continues to rise. Today, GoodRx’s mean take rate sits at roughly 15.5% of its transaction volume. This has grown from around 13.5% over the last few years while its competition has actually seen their take rates shrink. That divergence is a clear sign of the superior value GoodRx is generating vs. its substitutes — and it’s doing so while concurrently raising consumer savings rate by 20% in the same period.
d. Why Physicians Refer Patients to GoodRx’s Price Comparison Tool:
Physicians spend 14.6 hours per week on prescription administrative and adherence work with 90% of them saying this burden has risen in the last 5 years.
“Physicians have, for many years, expected to face prior-authorization (PA) hurdles… more recently, insurers have rapidly added PA requirements to more and more treatments… In my own practice, I now get insurer rejections or PA demands for a majority of the prescriptions I write each day.” — Jack Resneck President of the American Medical Association
Without GoodRx, the logistical prescription headache is simply a nightmare with offices hiring teams solely dedicated to handling the volume.
GoodRx’s price comparison tool plugs directly into essentially all physician workflows via deep EHR integrations. This way, the doctor is able to more easily consider cost in their prescribing decisions by accessing GoodRx price codes during a patient’s visit. GoodRx even provides an iteration of its app for physicians called GoodRx Pro to make using pricing codes as easy as possible. This interface cuts through red tape to help reduce time spent in this tedious area.
All of this convenience has led to GoodRx’s presence in 400,000+ doctor offices around the nation where trusted doctors promote GoodRx’s brand for free. Additionally, more than 2 million prescribers have a patient using the price comparison service and the GoodRx brand as a whole enjoys a gaudy 88% brand awareness among healthcare professionals.
To give an idea of how enthusiastic physicians are to recommend this price comparison service, 25% of GoodRx’s monthly visitors are physicians vs. 17% about a year ago. Impressively, over 80% of all physicians have now referred patients to GoodRx vs. 68% last year.
Some more highlights of GoodRx’s physician value proposition include:
- 93% of physicians believe GoodRx boosts medication access.
- 87% of physicians believe GoodRx helps patients stay on their medications.
To ensure the broadest and most relevant of EHR integrations for doctors, GoodRx recently signed a partnership with Surescripts. Surescripts is a leading health information network which facilitated the filling of 2 billion electronic prescriptions last year. It has 98% of the U.S. population is in its master index meaning this deal now makes GoodRx omnipresent at the point of prescribing for the vast majority of physicians — all seamlessly through their legacy EHRs.
Physicians will no longer have to independently seek out GoodRx but it will be a built-in piece of their workflow. This will remove more prescriber friction, reduce time spent on medication adherence and boost GoodRx’s doctor office traction further.
“This agreement with Surescripts strengthens our physician relationships by making it easier to use GoodRx. This allows us to go further up the prescription flow and grab more share.” — CFO Karsten Voermann
Similarly to GoodRx’s sky-high consumer NPS, its physician NPS also sits at an elite +90 vs. +86 when the company went public. This makes perfect sense considering the company is actively improving patient outcomes and therefore the reputations of associated physicians.
As an aside, I cannot send notes out about GoodRx without doctors openly sharing how readily they recommend it to their patients. The company sports a truly collaborative, win-win relationship with physicians.
e. Why Healthcare Embraces GoodRx:
GoodRx isn’t disrupting hospital systems, it’s merely supporting them by keeping patients healthier. There is no reason for healthcare not to embrace GoodRx as it helps to limit the current strain on our finite resources while manufacturing better results across the board. To put it plainly: GoodRx enables healthcare to do more with less. Today, that’s a requirement.
f. Why Pharmacists Accept GoodRx Price Codes:
In a perfect world for the pharmacy, it would collect the elevated U&C price as often as possible. GoodRx is directly preventing that goal from being realized, yet nearly all pharmacies accept these pricing codes and collect far lower total compensation anyway. Why?
First, some pharmacy chains like CVS directly own a PBM (and also an insurer) and so benefit from this profitable fixed cost business in an alternative way via the vertical integration.
Non-vertically integrated pharmacies rely on the incremental volumes that PBMs and their massive cohorts of members bring to the table. As I briefly mentioned, the proportion of total demand that PBMs represent allows them to negotiate increasingly favorable contracts with pharmacies. Common covenants in these contracts include mandating that GoodRx price codes be eligible for use at the pharmacy counter and preventing pharmacies from freely discounting on their own.
It’s not all bad news for the pharmacy. This added foot traffic means a more frequent opportunity to cross-sell other products that they stock. Specifically, Lab42 Research released data last year revealing 51% of consumers go to the pharmacy to make another purchase aside from prescriptions with half of that cohort spending an additional $11-$30 while there. GoodRx also more recently published data finding 25% of its users make additional trips to the pharmacy because of GoodRx with those consumers spending an average of $40 beyond the medication. This helps to make pharmacies more of an ally than an enemy.
PBMs are also very inconsistent in their price reporting which often leads to inaccuracies and angry patients at the pharmacy counter. GoodRx actively overrides these errors to ensure smoother transactions and more pleasant interactions for pharmacists. Furthermore, the organization is building new pharmacy workflow tools to help eliminate administrative redundancies and inefficiencies for this piece of the ecosystem and to boost collaboration further. Co-founder and Co-CEO Doug Hirsch has told us he expects “the fruits of our labor here very soon.”
The reliance on prescriptions to drive the bulk of a pharmacy’s success also continues to erode. For example, CVS’s Health Hubs place a greater emphasis on providing healthcare services rather than just pills and Walgreen’s is following suit. As pharmacies diversify their product offering, they should become more eager to relish the incremental traffic that GoodRx provides. But regardless of whether these chains like it or not, PBMs and GoodRx’s scale ensure the pricing codes are consistently usable at roughly 80% of pharmacies in the nation.
h. Why Bigger is Best Here:
According to CFO Karsten Voermann, GoodRx’s price comparison platform is several times larger than its closest competition. That size advantage fosters several competitive advantages beyond the aforementioned best-in-breed savings rates it offers and the compellingly unique network effect it enjoys.
Leading scale, especially when paired with elite NPS scores, generally translates into free, word-of-mouth marketing. And that’s the case for GoodRx with its largest customer acquisition channel (by far) being referrals and organic word-of-mouth. The company’s deep physician office presence is a leading source of this referral channel as product upgrades now allow these physicians to share a GoodRx price code through text or email right in the office. Consumers can also pick up a physical GoodRx card from tens of thousands of offices in the country. Other factors such as being cited 1800 times by major publications in 2019 and 4500 times by research organizations help as well — it does not pay for these placements.
Furthermore, familiarity makes GoodRx’s external marketing spend enticingly efficient. The name recognition has allowed this firm to rapidly grow its promotional activity while maintaining a payback period on that investment of 8 months during the last several years. Being the most well known in the space translates into more trust and — in this case — more appealing marketing conversions.
5. More GoodRx Products
GoodRx’s product mix is becoming increasingly diverse. In 2018, 97% of its sales came from the original price-comparison tool. This fell to 89% in 2020, 80% last quarter and is set to fall further to roughly 77% next quarter as new services gain lucrative traction.
The broadening mix lends itself to more cross-selling opportunities and therefore more lifetime value (LTV) with little added consumer acquisition cost (CAC). These enhanced unit economics justify more advertising spend to grab market share as customers become worth more to GoodRx.
To accomplish GoodRx’s ambitious objective of fixing American Healthcare wherever possible, it needed more products beyond discounted prescriptions. So it built more.