
“Third quarter results, which exceeded our expectations, demonstrate the ability of our teams to be agile in a dynamic operating environment.
CFO Meghan Frank
a. Demand
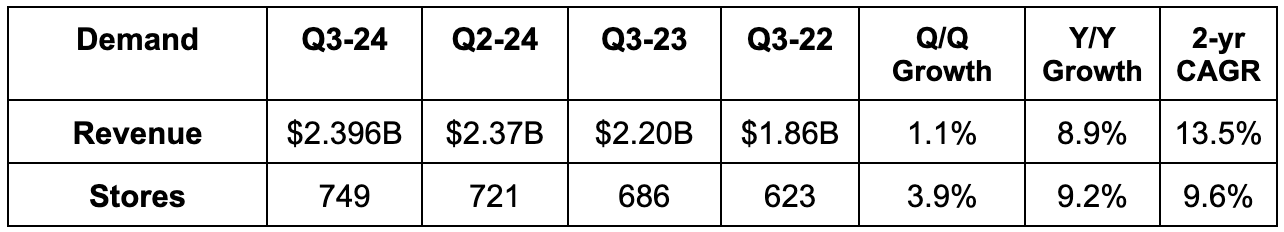
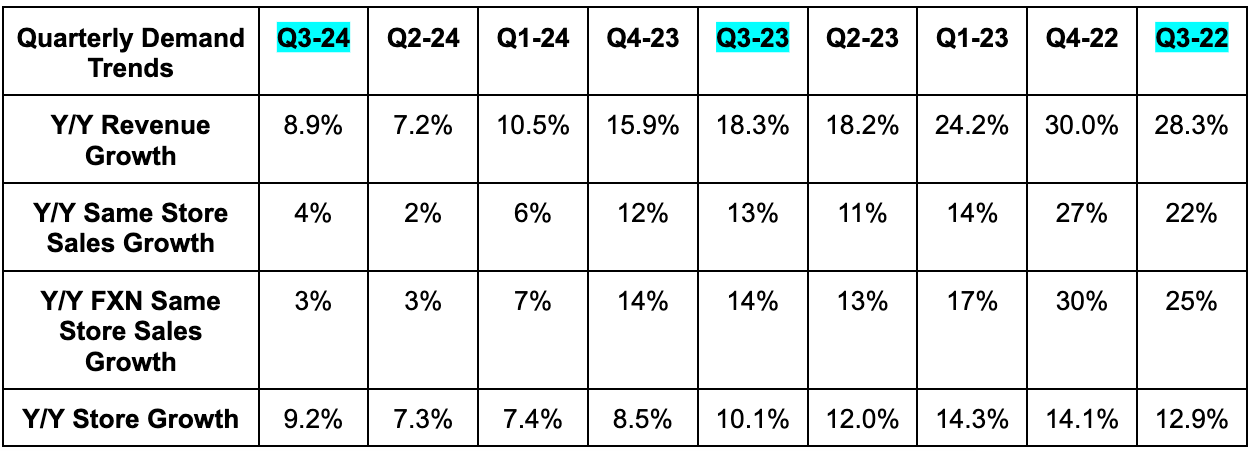
Lululemon beat revenue estimates by 1.7% & beat revenue guidance by 1.8%. Its 13.5% 2-year revenue compounded annual growth rate (CAGR) compares to 7.2% last quarter and 17.2% two quarters ago.
- Revenue rose by 8% Y/Y on a foreign exchange neutral (FXN) basis.
- Americas revenue rose by 2% Y/Y (GAAP & FXN) and comparable sales fell by 2% Y/Y (GAAP & FXN). Growth was stable Q/Q for Americas overall.
- Canadian revenue rose by 9% Y/Y; U.S. revenue was flat Y/Y and met expectations. This marked a needed sequential stabilization in Y/Y U.S. growth.
- China revenue rose by 39% Y/Y and 36% Y/Y FXN vs. 37% FXN growth last quarter. Comparable sales there rose by 27% Y/Y and 24% Y/Y FXN vs. 23% Y/Y FXN growth last quarter.
- Rest of World revenue rose by 27% Y/Y and 23% Y/Y FXN. Comparable sales rose by 23% and 20% Y/Y FXN. Growth was sequentially stable.
- Of the 28 new stores added Q/Q, 14 came from its previous purchase of its Mexico franchise partner.
- It also completed 13 more store optimizations during the quarter.
- Men’s growth was 9% Y/Y vs. 11% last quarter; women’s growth was 8% Y/Y vs. 6% last quarter; accessories growth was 8% Y/Y vs. 7% last quarter.
Leadership told us that it gained share in men’s and women’s premium activewear in all geographies including the USA. This compares to stagnant market share for its women’s business last quarter and marks more men’s share gains.
b. Profits & Margins
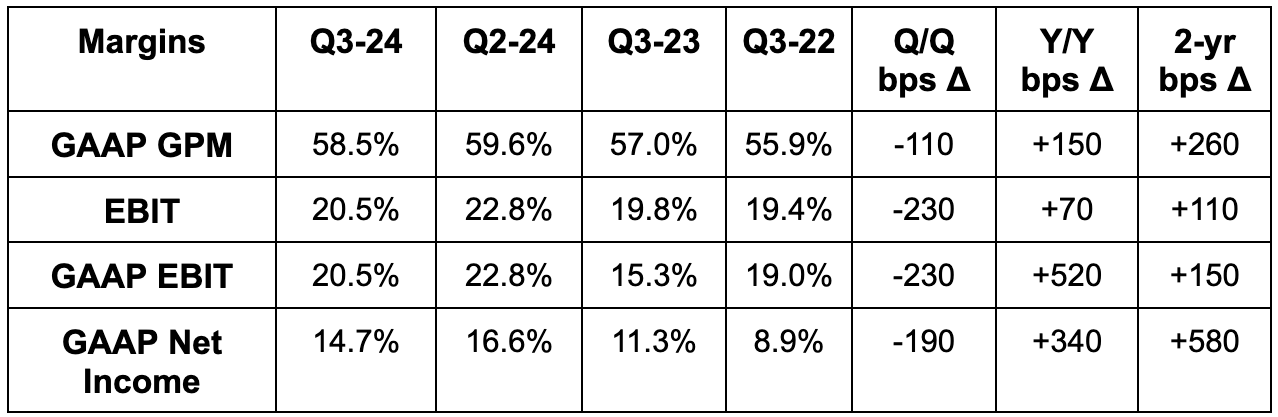
- Beat GAAP EBIT estimates by 5.5%.
- Sales, General & Administrative (SG&A) was 38% of revenue vs. 38.2% Y/Y for 20 bps of leverage. Leverage came from corporate SG&A and operating channel cost leverage. Excluding FX translation headwinds, SG&A leverage would have been 50 bps Y/Y and would have met Lululemon guidance.
- Beat $2.72 GAAP EPS estimates by $0.15 & beat guidance by $0.16.
- Excluding the same Q3 2023 charges as above, EPS rose by 13.4% Y/Y. This is despite a 30.2% tax rate vs. 28.5% Y/Y.
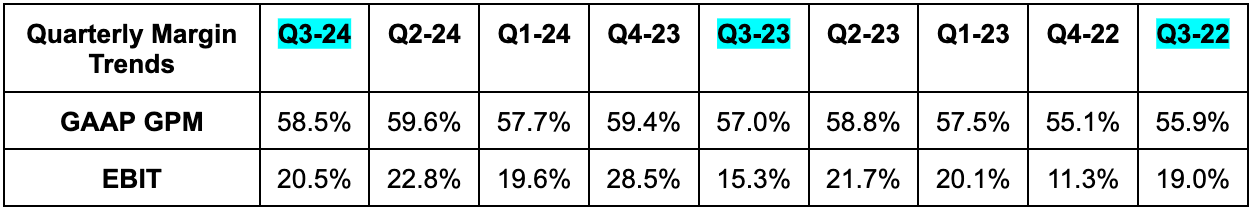
Finally, Lululemon beat GAAP gross profit margin (GPM) estimates by 90 basis points (bps; 1 basis point = 0.01%). The 150 bps of Y/Y GPM expansion was helped by a 110 bps benefit from inventory provisions during Q3 2023. Without this help, GPM would have expanded by 40 bps Y/Y. Last quarter, Lulu told investors to expect about 55 bps of Y/Y GPM contraction, the 40 bps of expansion was thanks to “product management of fixed expenses and some expense timing benefits.” Flat Y/Y markdown rates also helped, as it maintained its full price discipline.
c. Balance Sheet
- $1.2 billion in cash & equivalents.
- $394 million in revolver capacity.
- Inventory +8% Y/Y. Y/Y growth resumed as expected and as it guided to last quarter.
- Diluted share count fell 3.2% Y/Y. It added another $1 billion in buyback capacity and now has $1.8 billion remaining in total (about 4% of the market cap).
d. Q4 Guidance & Valuation
- Raised Q4 revenue guidance by 0.6%, which slightly missed estimates by 0.2%. This includes $20 million in incremental FX headwinds. Without this, it would have slightly beaten estimates and raised guidance by a little over 1%.
- Lowered $5.65 Q4 EPS guidance by $0.05, which slightly missed estimates by $0.02. Lululemon excludes buybacks from EPS guidance. As you can see in the section above, share count is meaningfully shrinking and will contribute to EPS growth. The reduction was related to FX translation headwinds.
- Guided to 25 bps in Y/Y GPM contraction for Q4, which is much better than the 75 bps contraction expectation.
- Guided to 120 bps in Y/Y EBIT margin contraction for Q4 to support continued foundational investments. This is worse than 100 bps of Y/Y margin contraction expected, largely due to incremental FX translation headwinds.
- Reiterated expectations for mid-teens Y/Y inventory growth in Q4