Meta needs no introduction.
1. Demand
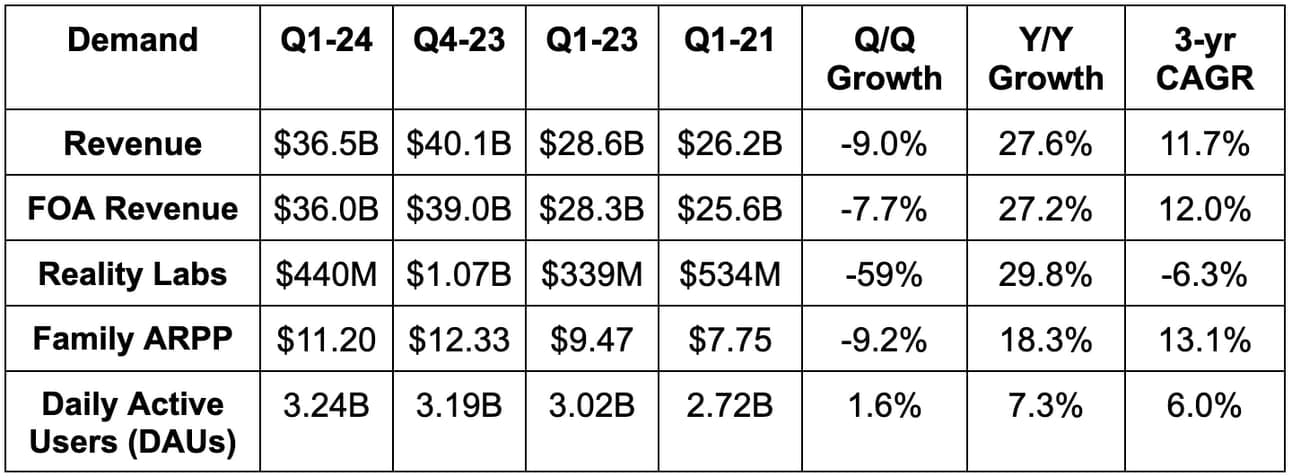
- Beat revenue estimates by 1.0% & beat its revenue guidance by 2.0%.
- Beat daily active user (DAU) estimates by 5.0%.

As of this quarter, Meta no longer discloses Facebook-only DAUs – only user metrics for its Family of Apps (FOA) overall.

2. Profitability & Margins
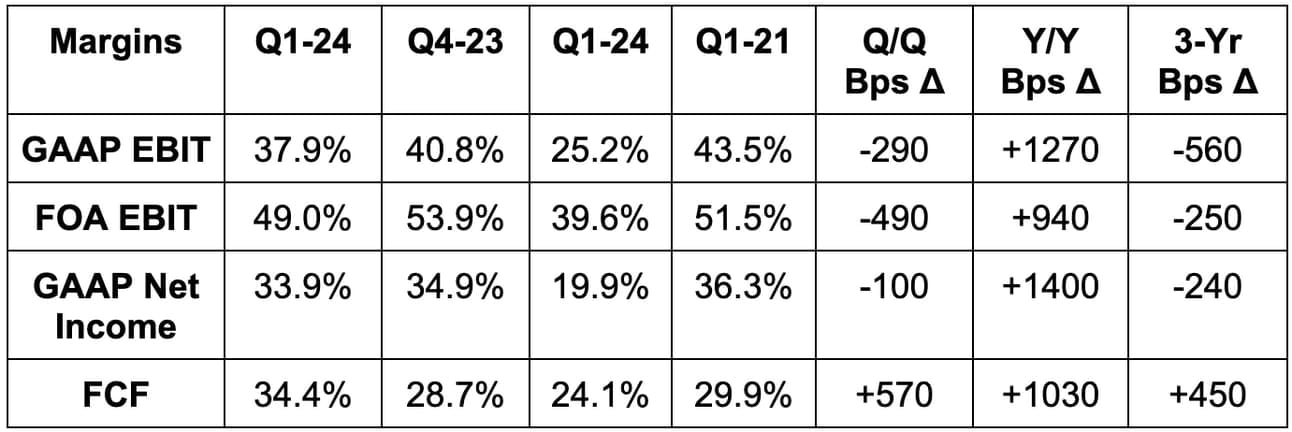
- Beat EBIT estimates by 3.1%.
- Beat $4.33 GAAP EPS estimates by $0.38.
- Beat free cash flow (FCF) estimates by 10.1%.


3. Fortress Balance Sheet
- $58 billion in cash & equivalents.
- $18.4 billion in total debt.
- Share count fell by 1.7% Y/Y.
- Headcount fell 10% Y/Y, but continued to rise Q/Q.
4. Guidance & Valuation
For the 2nd quarter, the midpoint of Meta’s revenue guidance missed by 1.2%.
For the year, it raised its operating expense (OpEx) guide by 1.0% & raised its capital expenditure (CapEx) guide by 11%. It also told us that 2025 CapEx would rise Y/Y vs. 2024.
Meta trades for about 20x earnings with earnings expected to grow by 35% Y/Y. With the 1% OpEx boost for 2024 and the Q1 EPS beat, I don’t anticipate earnings estimates falling much after this report. Conversely, it trades for about 21x 2024 FCF with FCF expected to grow by 13% Y/Y. I would anticipate FCF estimates being revised lower with the large CapEx raise.
Love this visual?
My good friend Carbon Finance sends out a weekly visual newsletter with the most important infographics, insights, and insider trades.
It’s completely free and only takes 5 minutes to read.
Join 10,000+ investors and subscribe here now.

