Netflix & Taiwan Semiconductor Earnings Reviews

1. Taiwan Semicondutor (TSM/TSMC) — Earnings Review

a. Taiwan Semi 101

Taiwan Semi builds chipsets for other companies like Nvidia, AMD and Qualcomm. It does so in its highly expensive and complex chip fabrication plants. These are called “fabs” for short.

Needed Definitions:

  • Fab means a factory.

  • Nanometer (NM) describes the chip technology. Smaller NM is more advanced, as it uses smaller transistors. This means TSM can pack more transistors into a single chip while making those chips more energy efficient and cost-effective.

    • Transistors function as switches or signal amplifiers.

  • “Advanced Technology” revenue is revenue from 3nm (N3), N5 & N7 technology. Anything under 7nm is “advanced.”

  • Wafer (sometimes called substrate) refers to the raw materials (like silicon) that are used to manufacture chips. Wafers are used to build integrated circuits (ICs), with the IC’s transistors guiding and facilitating functions. Nvidia’s Blackwell and Hopper chips are considered ICs.

  • Traditional foundry services entail the actual creation of a chip on a silicon wafer and testing these products. On the other hand, packaging involves storing, integrating and prepping chip components with thermal protection, connectivity equipment and encapsulation (physical damage protection).

  • Chip-on-wafer-on-substrate (CoWoS) is a packaging process that combines chips into a single unit. It allows things like GPUs, high-bandwidth memory (HBM) and custom chips to be vertically stacked and connected on a single wafer to improve speed and performance.

  • Lithography is the process of using thin layers of glass to etch or print chip patterns onto wafers. A light-sensitive material is added to wafers, “masks” are placed on top to guide where light and chemicals (used to manipulate wafers) etch desired patterns. Lithography is paramount to TSM’s production.

  • AI Accelerators, as the name indicates, accelerate high-performance compute (HPC) workloads in the realm of AI. GPUs are a type of AI accelerator, along with Application Specific Integrated Circuit (ASICs) (custom chips for specific use cases), Google’s Tensor Processing Units (TPUs; for machine learning). Some don’t include high-bandwidth memory (HBM) in this category, as HBM is for memory rather than things like data processing. TSM does include this. HBM facilitates ultra-low latency, high-bandwidth support for querying and data processing tasks as a wonderful complement to Nvidia’s Blackwell GPUs, for example.

b. Key Points

  • The tech roadmap & fab construction plans are on schedule.

  • Nvidia H20 sales in China being allowed would support more AI growth.

  • Gross profit margin (GPM) dilution was driven by foreign exchange (FX) and international expansion.

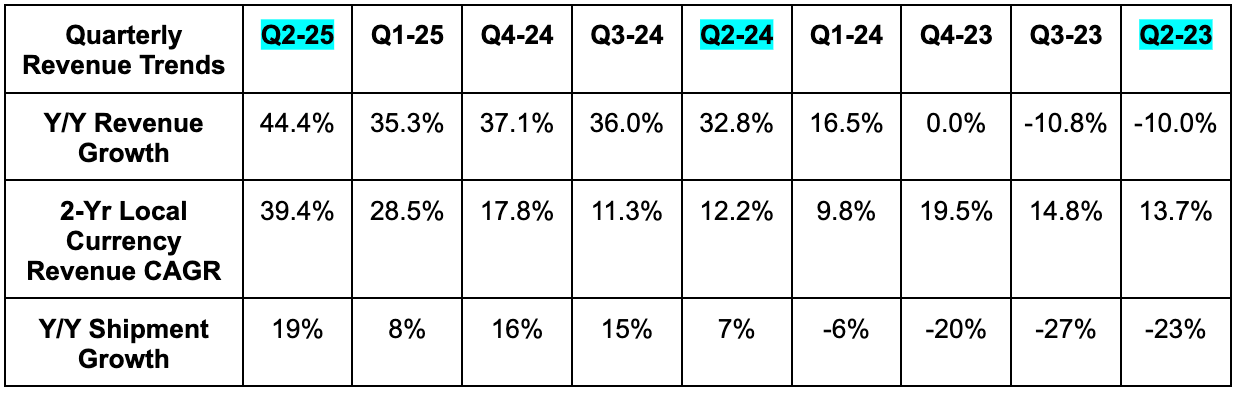
  • Nice acceleration in Y/Y growth despite a more difficult comp.

c. Demand

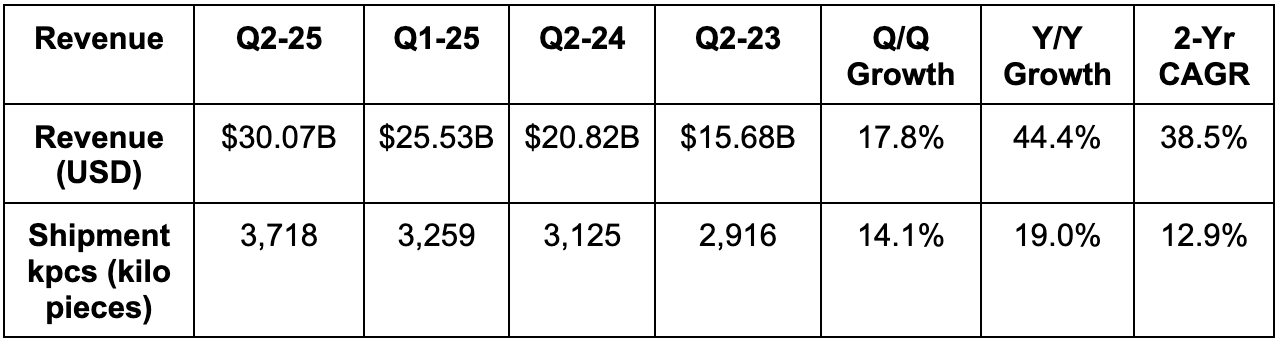
TSM beat revenue estimates by 1.6% & beat guidance by 4.4%. It reports revenue on a monthly basis, so strong April, May & June reports led to estimates rising materially beyond its initial quarterly guidance. In local currency terms, revenue rose by 38.6% Y/Y vs. 41.6% Y/Y last quarter and 38.8% 2 quarters ago.

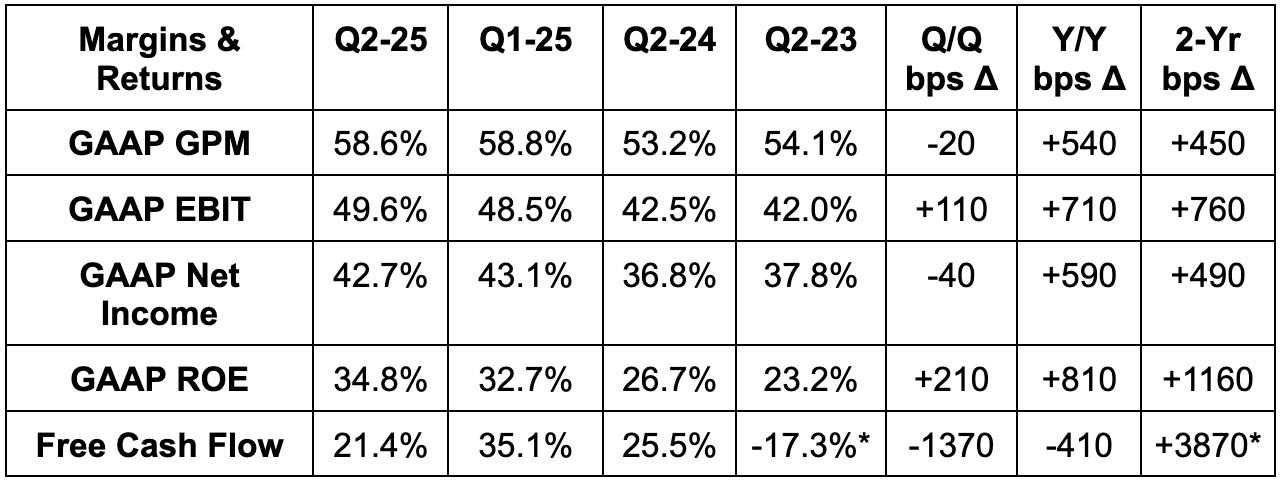
d. Profits & Margins

  • Beat EBIT estimate by 5%

  • Beat GPM estimate by 60 bps & beat GPM guide by 60 bps.

  • Beat $2.36 EPS estimate by $0.11.

    • EPS rose by roughly 60% Y/Y in local currency terms and by 67% Y/Y in U.S. dollars.

  • Excluding a large tax charge in Q2 2023, FCF margin would have been 7.7%.*

Q/Q gross margin contraction was partially due to ramping foreign exchange (FX) headwinds. Currency headwinds were nearly 5% larger than expected and led to a larger-than-expected 180 bps GPM headwind. Next, the GPM headwind from global manufacturing expansion was slightly more than 100 bps vs. just 80 bps assumed in its guidance. Newer facilities in the USA, Japan and Europe don’t enjoy the yield, capacity utilization, overall efficiency or economies of scale that their Taiwan facilities do. This means they’re currently lower-margin assets. Despite these two larger-than-expected headwinds, cost discipline and outperformance utilization helped the company surpass expectations. The things they can’t control turned into raging headwinds and they out-executed that problem within the things they can control.

e. Balance Sheet

  • $90.3B cash & equivalents.

  • $4.7B long-term investments.

  • Inventory rose 12% Y/Y.

  • $32.3B in total bonds payable.

  • Share count was roughly flat Y/Y.

  • Days of inventory on hand fell from 83 days to 76 days due to strong N3 and N5 performance.

f. Guidance & Valuation

For Q3, Revenue guidance beat estimates by 2%. They’ve seen no change in customer demand or buying patterns stemming from the trade war. No increased timidness; no pull-forwards. Separately, while Chinese stimulus is helping near-term demand for non-AI products, they think this will be short-lived and that the overall recovery for that demand bucket will be “mild.”

For Q3 profitability, 56.5% GPM guidance missed 57.4% estimates. The FX headwind rising from 180 bps to 260 bps Q/Q is the first reason for the miss. International expansion is the other. Importantly, they continue to expect international expansion over the next 5 years to lower GPM by about 250 bps during the first part of that planning period and around 350 bps over the second part. For context, their goal is to remain at or above a 53% GPM. 

They’d be comfortably ahead of that even if we included the full 350 bps headwind in this quarter. Furthermore, they expect to deliver best-in-class margins in every market. Meaning? Modest GPM contraction in future quarters will in no way mean their competitive moat is deteriorating. This was a reiteration they offer basically every quarter, but still great to hear. Finally, EBIT guidance beat estimates by 1%. This was thanks to the revenue beat.

“We have confidence in a 53% GPM or higher and I want you guys to pay more attention to the or higher.”

CEO C.C. Wei

For the full year, it raised revenue growth guidance from about 25% Y/Y to nearly 30% Y/Y. This is despite baking tariff-related uncertainty into the forecast and “more conservatism” in these targets. It also reiterated $40B for annual CapEx expectations. They expect CapEx to stay around those levels in 2026 and beyond. As long as revenue continues to grow like it should, that will drive enhanced capital efficiency.

“Recent developments are positive for AI's long-term demand outlook. The explosive growth in token volume demonstrates increasing AI model usage and adoption, which means more computation is needed, leading to more leading-edge silicon demand.

CEO C.C. Wei

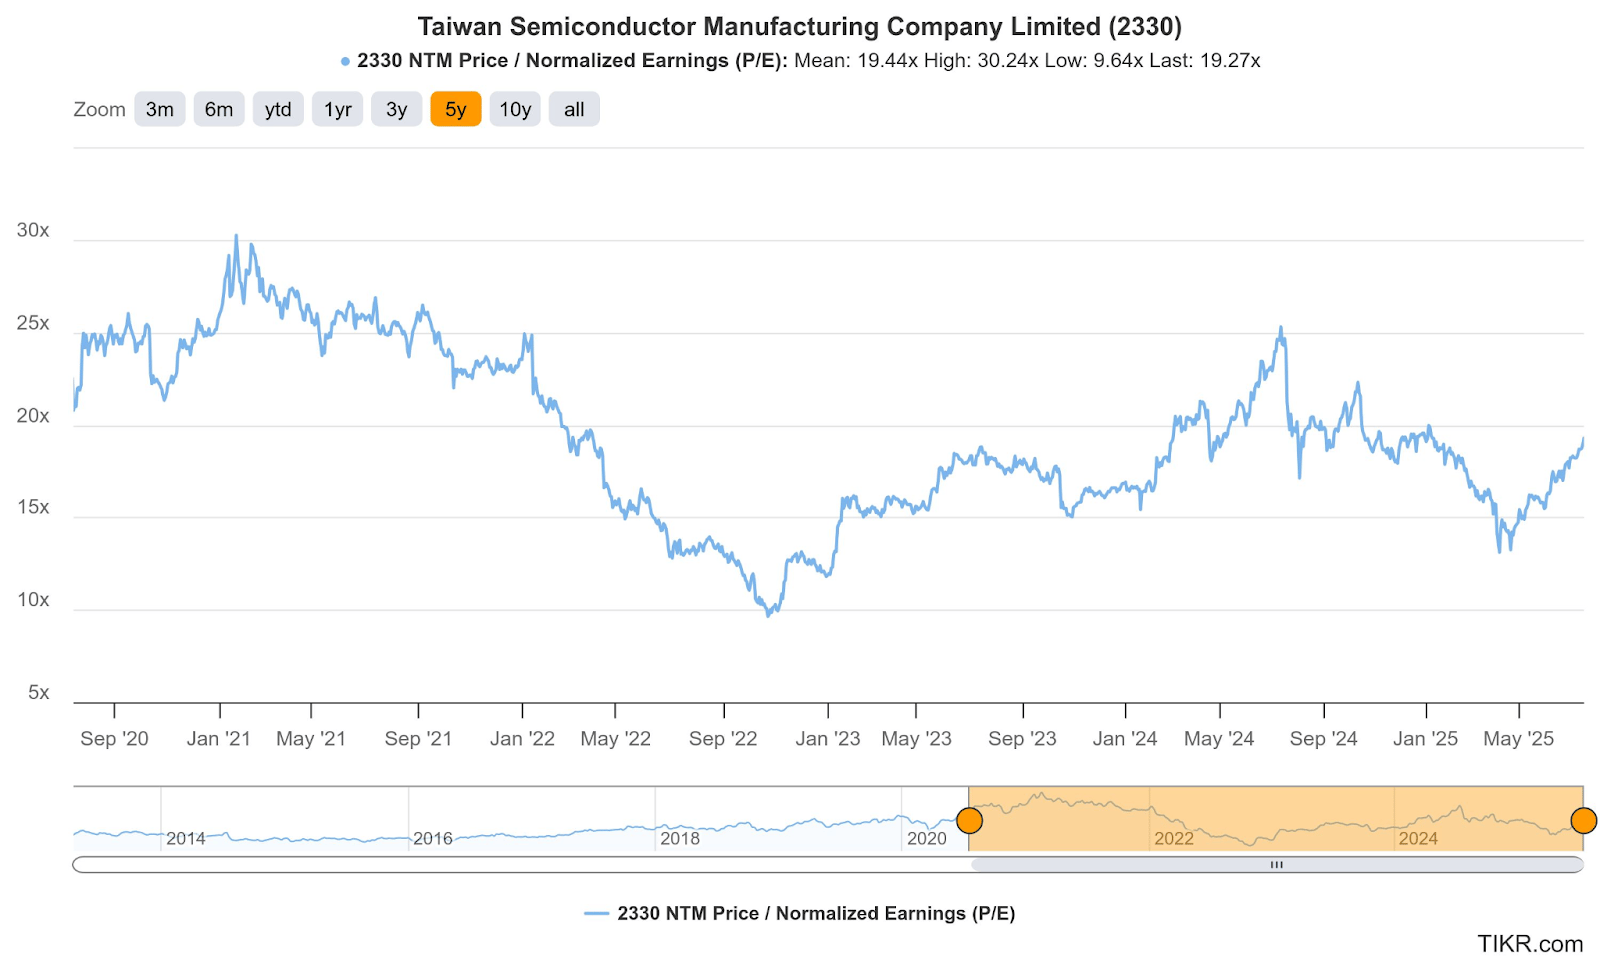
TSM trades for 18x forward EPS. EPS is expected to grow by 28% this year and by 16% next year. Estimates could modestly rise following this report (thanks to the annual revenue growth raise).

g. Call & Presentation

To read the rest of this article, track my portfolio and performance, gain access to 40+ earnings reviews this season and enjoy consistently thorough stock news/analysis, subscribe below. 20% annual discounts are ongoing but will wrap up soon.

This is the stock market content written for mature investors to keep you fully in the loop and informed. Not sensationalistic BS aimed to persuade or convince. That’s why several Fortune 500 CEOs are loyal readers… and we think you should be too.

Demand Context:

As expected, advanced technology drove TSM’s impressive, scaled and high-margin growth. As a reminder, this bucket includes all high-performance compute (HPC) and AI-related use cases and now makes up 74% of total revenue vs. 73% Q/Q and 67% Y/Y. Within advanced technology, N3 technologies again carried TSM, with that product soaring to 24% of revenue vs. 15% Y/Y. N5 and N7 as a % of advanced revenue both fell Y/Y as customers shift demand to N3 at a rapid pace.

Specifically by Platform:

  • HPC was 60% of total revenue vs. 59% Q/Q & 52% Y/Y.

    • Data center demand continues to be massive and improved Q/Q. 

  • Smartphone was 27% of total revenue vs. 28% Q/Q and 33% Y/Y.

  • Auto and IoT were both 5% of revenue and roughly stable both Y/Y and Q/Q.

Nvidia H20 Sales in China:

Nvidia will again be allowed to sell its H20 chips in China. It’s too early to say how this will impact its roughly 45% AI hardware CAGR over the coming years, but they were clearly excited about this news. It sounds like they could be raising that 45% target in the coming quarters if regulation continues to coorporate.

Manufacturing Footprint:

Most of this section is review, as construction plans were all reiterated this quarter.

TSM keeps marching full-speed ahead with its plans to invest $165B in USA manufacturing. Over the coming years, when this is all wrapped up, the new facilities will support 30% of its sub-N2 manufacturing. Leadership knows companies want to de-risk exposure to Taiwan amid its consistently heightened geopolitical risk. This is a great way to do that, with healthy support from the U.S. government and an ability to charge a premium for “Made in the USA” products.

Overall plans include 6 wafer manufacturing facilities. The first is already done and supporting production yields on par with Taiwan facilities. That bodes very well for the long-term margin of this facility, but supply chains and economies of scale in the USA are far inferior to Taiwan for TSM at this point in time, which is why the aforementioned GPM headwinds exist. The second facility was recently completed and supports N3 manufacturing. It’s gearing up to ramp production as we speak. The third facility (for N2 and more advanced) is being built, with fabs 4-6 coming thereafter and 2 packaging facilities as well as an R&D center coming thereafter. Having all of that in Arizona should begin to emulate the supply chain efficiencies TSM enjoys in its home country. 

  • The specialty fab in Japan is delivering strong yield and the 2nd facility will begin construction by the end of the year.

  • They continue to talk about “strong support from the German government.”

  • In Taiwan, they have plans for 11 new manufacturing fabs and 4 packaging facilities over the coming years.

N2 & N3 Context:

N2 will ramp up at the same pace as N3 did. They’re still capacity constrained, which is why the ramp will not be even faster to address rising demand levels. Despite this, the revenue contribution for N2 will grow more quickly than N3, considering it expects pricing for the newer technology to be higher. That should also alleviate capital intensity concerns for N2. According to leadership, profit dynamics are still similar (if not better) compared to N3 thanks to the higher price tag.

Sticking with price for a moment, TSM supply for all advanced technologies – including N7 – remains “very tight.” That should support greater elasticity of demand and its already excellent margin profile. It pays to be the technological leader in your space. The company was asked about N7 and N5 overcapacity as they shift some of those manufacturing lines to N3 and newer models. They are not dealing with any kind of overcapacity, and the supply tightness is clear evidence of that.

Tech Roadmap:

Its N2 and A16 (1.6 nanometers) technologies “lead the industry in addressing insatiable demand for energy efficient computing.” This innovation leader is not growing complacent or resting on its laurels. It continues to urgently and effectively sprint to drive more product improvement and remain ahead of the pack. It still expects N2 tape outs (custom chip designs) to surpass N3 and N5 over their first two years. It also continues to excitedly talk about great performance gains for N2 vs. N3E (most advanced N3 product). Chip density is 15% higher and power is 25% better at the same speed requirements. This is “well on track for volume production” by the end of 2025, with N2P coming shortly thereafter as an N2 family iteration to extract even more performance gains.

  • A16 will come next, with 8.5% chip density gains and 17.5% power improvements at the same speed vs. N2P. Compared to N2, A16 is 25% more powerful at the same speed with 20% density gains. Scaled production for this product will begin next year.

  • A14 will come in 2028 and many more iterations will surely come after that. Again… It's always innovating. 

CoWoS:

TSM leadership continues to be CoWoS capacity constrained. Last quarter, it sounded like the team said they’d find supply/demand balance by the end of next year. This year, leadership told us that they worded their previous answer poorly. Instead of creating demand equilibrium by the end of next year, they expect to “narrow the gap.” While this might mean it will take more time for TSM to take advantage of all revenue opportunities, it also probably means the runway will be longer for this current hardware boom. And it’s not like TSM is struggling to find growth even with this present bottleneck.

Humanoid Robots:

Leadership was noticeably excited about the humanoid robot opportunity. They talked about the massive compute needs for a single model vs. something like an electric vehicle, but, according to them, it’s too early to know how large this opportunity will be.

h. Take

Another excellent quarter from a world-class team and their world-class company. Taiwan Semiconductor continues to dominate the semiconductor foundry sector and these financial results simply offer more evidence of that being the case. There is nothing to pick at here. The GPM dilution doesn’t bother me in the least, as it’s a byproduct of rightfully turbocharging international expansion and shedding some geopolitical risk. I continue to think this geopolitical risk is the only thing that can hold TSM back in the coming years. From a fundamental execution perspective, they continue to be flawless. If they were based in North America, other parts of Asia, Latin America or Western Europe, this would easily be trading at a significantly higher valuation.

2. Netflix (NFLX) Earnings Review

a. Key Points

  • Impressive continued operating leverage.

  • Outperforming member growth.

  • The new homepage is now rolling out.

  • The ad business is trending modestly ahead of expectations.

b. Demand

  • Slightly beat revenue estimate & slightly beat guidance. Revenue outperformance was largely driven by foreign exchange (FX) favorability. Member growth did beat internal expectations, but that was thanks to a surge towards the end of the quarter, so the revenue impact was small.

  • Beat North America (UCAN) revenue estimate by 1.5%.

  • Beat Europe, Middle East & Africa (EMEA) revenue estimate by 1.1%.

  • Missed Latin America revenue estimate by 2.1%.

  • Slightly missed Asia-Pacific (APAC) revenue estimate.

c. Profits & Margins

  • Beat EBIT estimate by 3.8% & beat guide by 2.7%.

    • FX favorability and some expense timing drove the beat.

  • Beat free cash flow (FCF) estimate by 9%.

  • Beat $7.03 EPS estimate by $0.16 & beat guide by $0.12.

    • EPS rose by 47% Y/Y.

d. Balance Sheet

  • $8.2B in cash & equivalents.

  • $14.5B in total debt.

    • It paid off $1B in senior notes during the quarter.

  • Diluted share count fell by 1% Y/Y. It has $12B left in buyback capacity under the current program.

e. Guidance & Valuation

For the third quarter, revenue guidance was 2.2% ahead of estimates, EBIT guidance was 4.3% ahead of estimates and $6.87 EPS guidance was $0.20 ahead of estimates. CFO Spencer Neumann also told investors on the call that they expect the member growth strength enjoyed towards the end of Q2 to persist through the end of the year. The content slate is loaded for Q3-Q4.

For the full year, Netflix raised its revenue guidance by 2.3%, beating expectations by 0.9%. They said this was largely thanks to FX favorability, although underlying operating strength also contributed. For evidence, they raised their FX neutral (FXN) growth guidance for 2025 from 15.5% to 16.5% and also narrowed the range to signal rising conviction in the improving target. It also raised EBIT margin guidance from 29% to 30% (or from 29% to 29.5% on an FX neutral basis) which beat 29.6% margin estimates. Some wanted a larger EBIT margin raise, but it’s important to remember that expense timing favorability drove the Q2 profit beat; this will flip to unfavorability in Q3 and Q4. Again… Most of 2025’s planned hits are coming in Q3 and Q4 and it wants to support those releases with effective marketing. Finally, it raised annual FCF guidance by 3.1%, which missed estimates by 8%.

Netflix trades for 46x forward earnings. EPS is expected to grow by 30% this year and by 21% next year. It’s safe to expect material upward estimate revisions following this quarter and guidance.

f. Call & Release

Consumer Health?

Just like last quarter, Netflix is seeing zero signs of consumer weakening. The low price point of its offering and arguably the best value prop in streaming both help a lot in that regard. Retention, plan mix and engagement patterns are unchanged since the trade war began.

New Homepage:

Netflix began rolling out the homepage update it has been teasing for a few quarters. It’s live for 50% of its members and is “outperforming pre-launch testing while demonstrating strong member interest in new features.” The interface intuitively surfaces popular titles and prominently labels top ten hits as such. Per the team, it’s "simpler, more intuitive, and better represents the breadth of entertainment.” When paired with its new recommendation engine, engagement gains should be tangible. This engine is able to granularly and dynamically customize title displays based on member data profiles. Personalization, just like it does in advertising, routinely fosters better engagement, retention, monetization and success for products like this one.

Nurturing the Ecosystem:

While the upgraded homepage will surely be a positive for watch hours, content is a more important piece of maximizing that metric. And just like Netflix has featured in previous quarters, Q2 enjoyed several hit releases. Its KPop Demon Hunters film not only became a massive, 80 million-view hit, but it also made a huge splash in the world of music. The bands created in that show have the #1 song on Billboard Global Charts and the #1 movie soundtrack on Spotify. The film’s album is also the first K-pop release even to climb to #1 in the USA. Impressive. In Germany, its Exterritorial film was its fourth-most watched foreign title and Squid Game Season 3 has already become a hit 6 weeks into launch. All of this traction helped watch hours grow 1% Y/Y over the first six months of 2025. I realize that doesn’t sound impressive, with membership growing well in excess of that clip and so watch hours per user falling Y/Y. When considering basically all of its most popular releases are coming during the second half (Wednesday; Stranger Things; Happy Gilmore etc.), it’s more respectable. They also cited more competition as a reason for the slower engagement growth but expect acceleration from here.

Netflix has also done a great job with establishing talented, seasoned teams in local markets. This helps dearly with understanding what people gravitate towards and what to produce for specific audiences. The company highlighted Spain as a standout market this quarter, and will invest another billion Euros in that market by 2028 to keep bolstering its content slate.

Aside from releasing great scripted entertainment, content diversity is a powerful lever for member engagement and retention. I talk about this a lot. A streaming library packed with hit comedies, dramas, mysteries and romantic flicks will inherently appeal to a wider audience than one specializing in a single subsection of scripted content. The wider menu will mean more interested eyeballs per household and more cancellation objectors when one member of that household wants to end their plan. Netflix has run this scripted content breadth playbook flawlessly for years, and enjoys best-in-class retention because of it. 

I think the most exciting part of that reality is Netflix is far behind others in rounding out non-scripted libraries. Whether that’s via sports, news or live events, there is so much work left for it to do (not to mention video and party games). As that happens, I expect engagement to get even stronger, content objectors to get even more frequent and best-in-class retention to get even better. Along these lines, this quarter, it inked a deal with TF1 in France, which unlocks a large array of linear channels with access to weekly game shows and live sports.

“Why TF1 versus some other partner? Well, we know each other really well. We wanted our first partner to be in a big territory. We wanted to pick the leading local programmer.”

Co-CEO Greg Peters
  • No single title represents 1% of total viewing hours. There’s no content concentration risk in this business. This is also why consistently delivering a lot of popular content is so important. One hit cannot carry a quarter for this company.

  • Titles like Lucifer continue to attract significant interest 2 years after launching. During the quarter, it reeled in 20 million views.

  • The world-class content ecosystem is why price hike reactions have been as expected this year (and last year). There continues to be great pricing power in this subscription.

Live Capabilities:

Netflix inked a key milestone this quarter as it successfully hosted two large live events simultaneously. There are no discernible latency or production quality issues like we saw with its first NFL game.

Competition:

While Netflix’s momentum remains palpable and its financial success impressive, analysts did ask about stagnating market share. After years of steady gains, market share has been rangebound between 7.4% and 8.4% since 2023. It’s currently near the top of that range as of June, but hasn’t been able to break through the ceiling. This stagnation has occurred while YouTube jumped from 8.5% to 12.8%, Prime Video modestly rose and Disney delivered steady market share. I’m confident that Netflix leadership wants to look more like YouTube than Disney, and they were enthusiastic on the call about their desire to grow market share in future years. Some reasons offered for the stagnation were several competitive entrants, the paid sharing crackdown and the back half-weighted content slate for 2025. All I’d say for the competitive entrant reason is that it hasn’t stopped YouTube from taking more share.

Lack of market share gains won’t grind NFLX’s growth engine to a halt. Streaming is growing at a 15%-20% CAGR for the foreseeable future, so stability means Netflix can deliver that level of growth too. Still, I’d love to see them taking a larger piece of the pie and enjoying even faster growth. I view Netflix as the highest-quality brand in the space and I’d expect its market share trajectory to emulate that positioning. Maybe I’m being too picky.

Advertising:

The company finished releasing Netflix Ads suite to all 12 of its advertising markets. This is its in-house ad tech platform that connects its available impressions to advertisers and buy-side conduits like Yahoo and others. The product gives buyers more flexibility with buying, granularly targeting, using data and leveraging their favorite campaign operating software like Trade Desk’s Kokai. The enhanced access coming from buy-side integrations has been a big win for ad growth.

Overall, this full rollout has gone about as expected. Buyers are pleased with rising content scale, audience reach and strong engagement per member Netflix delivers vs. its peers. From here, it will be about learning, iterating and a constant flow of rapid product introductions (like interactive ads) enabled by Netflix owning the backend of this platform. That ownership innately fosters greater control and autonomy to build exactly what it wants.

Outside of programmatic advertising, this year’s U.S. upfronts went as expected. As a reminder, “upfronts” are essentially presentations that platforms such as Netflix give to prospective ad buyers to show off reach and capabilities and sell chunks of impressions in advance. They’re less precise than buying impressions in a more real-time, one-by-one manner (like with Netflix Ads Suite), but are still a big part of the advertising market. Performance for the ads suite and at these upfront presentations led Netflix to reiterating 100% Y/Y ad revenue growth guidance for 2025. On the call, they told us that exact growth expectations for the segment are modestly higher than at the start of 2025.

AI:

AI is greatly lowering the bar for adding complex effects to specific titles. Things like anti-aging technology and emulating a collapsing building in Argentina just weren’t possible before the GenAI explosion. Tools needed were far too expensive to use the vast majority of the time, but that’s no longer the case. Aside from using AI to make better films, Netflix will keep investing in this technology to continuously upgrade its content recommendation engine. AI should be able to more quickly match users with titles, which would support all of the engagement metrics NFLX cares about.

g. Take

There are two things I wanted to pick on a little bit before praising the overall quarter. First, market share stagnation is not something you’d expect for a leader in the space – especially while the other leader keeps taking a larger piece of the opportunity. Second, watch hours per viewer declining Y/Y is also not something I find encouraging. I do think that’s related to hit releases being heavily skewed to Q3 and Q4 and also think engagement growth will recover accordingly. If that doesn’t happen, I’d begin to think these two pieces of evidence are signs of Netflix’s dominant industry grip loosening just a tad. That’s not my expectation, but as investors, we must always consider downside risks.

With that said, the overall numbers were still very good. Growth at massive scale and with rapid margin expansion is a recipe to always be praised. That is what Netflix has been delivering for the last few years now. They’ve fostered a sharp re-acceleration in growth while surgically managing expenses and their efficiency… all I can say to that is “well done.” Through its best-in-class library, world-class recommendation engine, ubiquitous brand and improving content breadth, it is crystal clear that this and YouTube are the leaders in this compelling industry. And candidly, I think there’s a mile between these two and 3rd place.

A perfect quarter? No. But close to perfect? Yes.

Reply

or to participate.