
Happy Holidays! This week and next week will be relatively void of news, events and data to analyze and cover. But? I commit to sharing valuable content with you every single week. This week, I put together a lengthy piece on the income statement, with a boatload of needed context and nuance to explain how I read it.
Table of Contents
- 1. Income Statement 101
- 2. High Growth Gross Profit Comp Sheet
- 3. DraftKings (DKNG) – New Data
- 4. Market Headlines
- 5. Macro
1. Income Statement 101
a. Introduction
Learning how to read and contextualize financial statements is a prerequisite for effectively stock picking for the long haul. It helps us evaluate the health of a company, what their resources allow them to do, and how they’re performing.
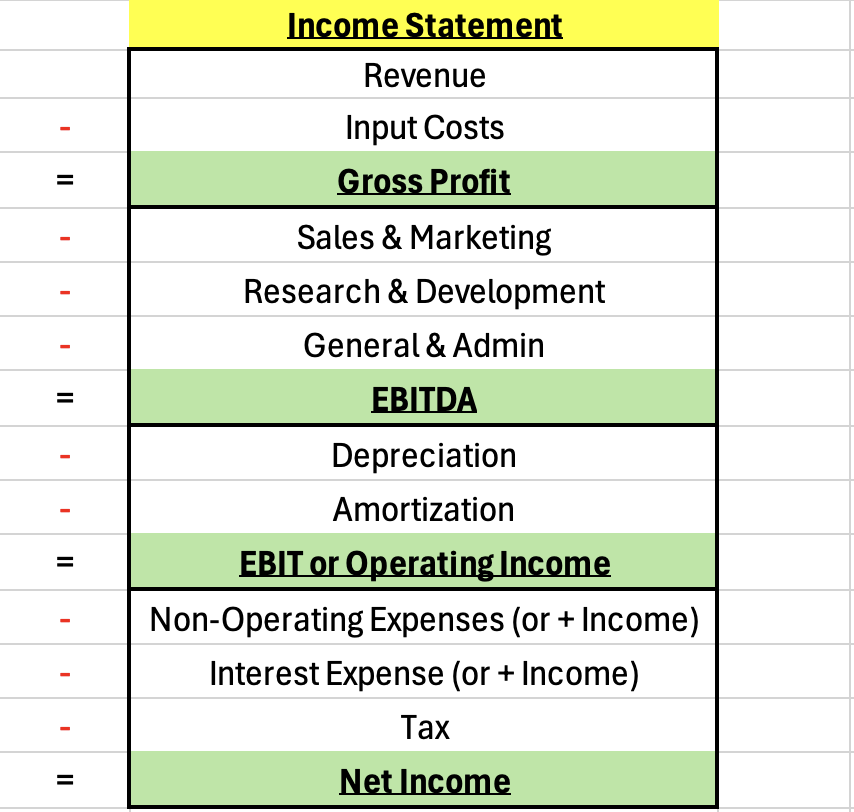
The income statement offers a picture of a firm's financial results over a finite period of time (increments of 3 months). It’s this financial statement that shows us how much demand a firm generated and how profitable that business was. Importantly, unlike the cash flow statement, the income statement uses accrual accounting. Accrual accounting records revenue when the goods or services for that revenue are delivered/completed. It deducts expenses when the company receives the good or service that the expense entailed.
b. Demand Metrics
Revenue:
Revenue is the most common demand metric and is often referred to as the “top-line” on the income statement. Some companies report this in gross terms, while some exclude returns/cancellations and report in net terms. Net disclosures are especially important for consumer-facing firms and marketplaces, where returns are simply a natural part of the business model. And while this number is generally understood, there are several more metrics to contemplate when judging the complete demand picture.
ARR:
Annual Recurring Revenue (ARR) offers a next 12-month view of how much visible (or recurring) revenue a firm expects to realize. This is highly important for subscription-based businesses with multi-year contracts. Firms like CrowdStrike consider it their most important demand gauge. For other consumption-based models like Target, Delta or Snowflake, ARR isn’t relevant as customers pay as they consume and consumption is not guaranteed to recur.
RPO (Remaining Performance Obligations):
Backlog is secured contracts or demand waiting to be fulfilled and billed for at some point in the future. Deferred revenue comes when a customer pays for a good or service in advance. Deferred revenue is then recognized as revenue when the work is done (based on accrual accounting). Remaining Performance Obligations (RPO) = deferred revenue + backlog. This is a forward-looking reading for how much service fulfillment and revenue recognition should be enjoyed. You’ll also often hear the terms “bookings” and “billings” thrown around. Bookings represent business contracted over a finite timeline but not yet completed. This feeds backlog growth (and so RPO) and is considered “unbilled demand.” Bookings turn into billings when that contracted business is invoiced. This invoicing can be based on pre-set schedules or be more fluid.
If billings occur for services that have not yet been conducted, it boosts deferred revenue. If billings occur for services that have been completed, it adds to current revenue and does not boost deferred revenue. In this case, these billings will sit in accounts receivable until the company is paid and revenue is recognized. Companies like Salesforce will routinely provide “current RPO” which is RPO expected to be recognized as revenue at some point over the next 12 months.
Demand Retention & Expansion (Most relevant for subscription businesses and companies with multi-year contracts):
Next, there are a few other important metrics to consider when learning how quickly revenue contribution from a firm’s existing client base is growing. These are excellent statistics that measure the quality of customer cohorts, compare how that quality is trending from year to year, and gain insight into how much growth runway is left within existing customers. Gross revenue retention (GRR) measures existing client end-of-period revenue vs. beginning-of-period revenue. It does not credit existing client revenue expansion if a customer adds a new product, for example. It is merely trying to capture and depict customer churn. As an overgeneralized rule of thumb, 95%-97% GRR is considered good, while anything above that is considered great.
Net revenue retention (NRR) is the same as GRR, except it includes the impact of existing customer upsells, so captures both churn and growth runway for an existing book of business. NRR is often called dollar-based net revenue retention (DBNRR). Generally speaking, below 100% NRR is an issue, as it shows churn is a larger headwind than the tailwind of customer expansions. 100%-110% is considered fine, 110%-120% is good and 120%+ is great. As an important caveat, sometimes companies shift focus to winning new business vs. growing existing customer business. This can lead to NRR pressure being the correct concession to make, as focus on winning more customers can sometimes be a more lucrative pursuit. SentinelOne is a great example of this right now. Lastly, dollar-based net expansion rate (DBNER) isolates existing customer revenue growth and excludes the impact of churn.
Like ARR, these retention & expansion-minded metrics are valuable for recurring revenue or subscription business models.
Demand Pipeline:
Demand pipeline is an even more forward-looking demand metric than RPO. This measures the size of potential contracts from interested new customers and cross-sell opportunities within existing client bases. This is purely unbooked, forward-looking and a much more speculative and subjectively calculated demand metric than RPO. Some companies only consider advanced, high-probability opportunities to be part of the pipeline; some companies consider any company that has expressed any preliminary interest at all to be part of the pipeline. For this reason, it’s not a valuable metric for comparative analysis, as calculations are far from uniform across companies. It is, however, more valuable when observing how a company-specific stream of new opportunities is trending.
Demand Summary & Thoughts:
Revenue on an income statement helps us understand how a company’s demand has been trending; these metrics, in addition to a company’s forward revenue guidance, tell us how that demand should trend when looking ahead. If revenue growth is stellar, but backlog is quickly shriveling up, that could mean a company’s best growth days are behind it. Considering that stocks trade on forward expectations, this is when even rapid, outperforming revenue growth can be punished. Stocks will react aggressively to sharp disappointment or positive surprise in these demand metrics BECAUSE they hint to investors what revenue will look like in future quarters.
c. Profits & Margins
Gross Profit:
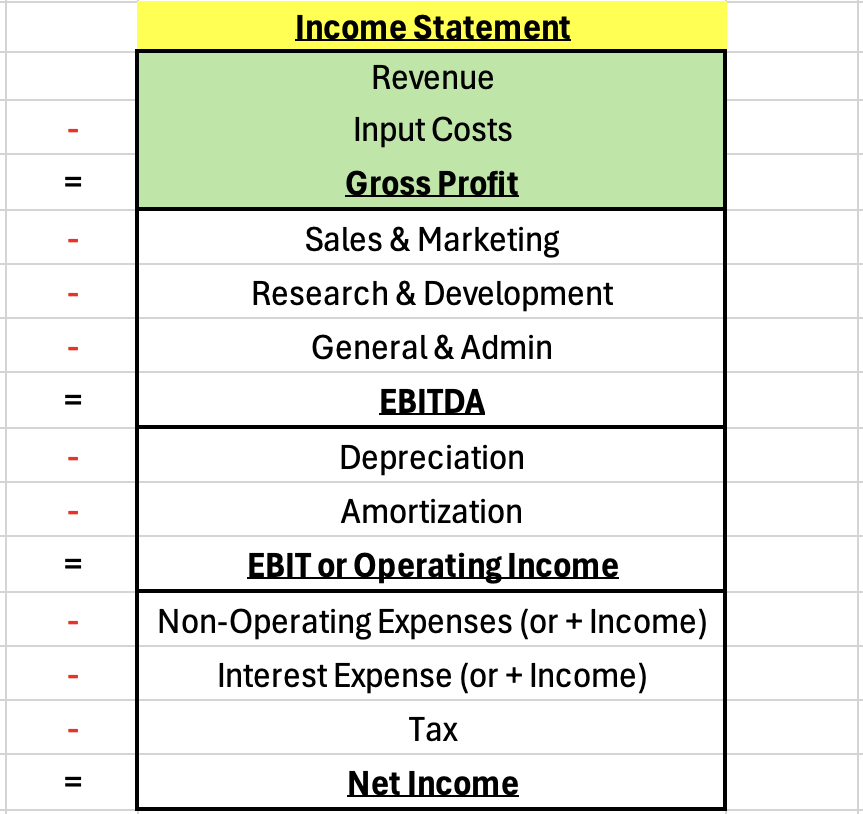
Gross profit is revenue after input costs, or “cost of goods sold” (COGS) are deducted. I’ll use these two terms interchangeably. Gross margin is gross profit divided by revenue. Cotton for a Nike sweatshirt, diesel for JB Hunt and app store fees for Duolingo are all considered to be COGS, and that’s important to highlight. Input costs look entirely different across industries and input cost intensity varies widely across various sectors too. For example, software has very low relative intensity. Most of the COGS come from paying hyperscalers for access to infrastructure, and average GPM for the sector as a whole is over 64%. For car makers, the steel, semiconductors, engine, battery etc. that go into making each unit lead to higher COGS. So? Average GPM for the sector is below 15%. For branded drug manufacturers, exclusivity periods (to protect hefty R&D investments) artificially block competition from entering for a period of time. This removes competitive risk, juices product differentiation and inflates GPM for these companies, leading to a 60%+ GPM on average. All of this is to say that there’s granular nuance for each sector that means we cannot fairly compare GPM between dissimilar industries. But? We can compare it to similar peers to glean insight. And? We can closely track GPM trends for specific companies to see if pricing power is improving or worsening.
For example, if two competitors in endpoint security, with similar scale, boast GPMs of 80% and 70%, respectively, that directly hints at quality of product offering. Why? Because quality fosters pricing power, and pricing power directly leads to higher GPM. If I can sell something that costs me $5 in COGS to make for $11 instead of $10, GPM rises. This is why qualitative and quantitative analysis are always tightly correlated. Do you claim to have amazing products and insane pricing power? Cool… your GPM should look better than the other guy’s. You should be adding more revenue than them too. Within examples like Nvidia, its sky-high gross margin is the direct byproduct of selling better GPUs than anyone else on the planet can make.
As always, there’s more context needed when determining if GPM contraction is actually concerning or not. Intuitively, 2 years of contraction is more alarming than a random quarter of contraction, but there are more items to consider. Sometimes, GPM contraction is related to changing product mix. For Shopify, its thriving payments suite has led to another massive lever for profit dollar growth. At the same time, the margin contribution from payments is dilutive to overall GPM. This is a concession Shopify is elated to make, as it knows doing so allows it to maximize overall gross profit dollars. Stocks are valued based on profit dollars and profit growth… not margins. A company with $10 billion in gross profit growing 100% a year with a 1% margin will be more valuable than a company with $1 billion in gross profit growing 50% a year with a 99% margin.
Next, exogenous factors like worsening macro can also lead to temporary GPM contraction. Some portion of input costs will often be fixed. If, using our previous example, bad macro leads to $5 in input costs yielding $9 in revenue instead of $10 in revenue, that will lead to GPM contraction, even if a company’s pricing power in a normal environment is intact. It’s very hard to be entirely immune from macroeconomic swings. Finally, one-off items like inventory impairment charges for Lululemon last quarter can temporarily weigh on GPM, with that headwind being transitory rather than a structural byproduct of a permanently worsening product suite.
One more caveat on using GPM in comparative analysis. CFOs have a certain degree of autonomy when deciding what is considered an input cost and what is considered an “operating cost” (much more on this next). When comparing GPM quality between similar companies, it’s important to make sure GPM accounting is roughly similar or to know when it isn’t. Skillz and other bubble stocks during the pandemic loved classifying every expense as anything other than an input cost. This led to a sky-high, nearly 100% gross margin that these companies sold as a reason for shareholders to believe free cash flow and net income would eventually follow. But? This wasn’t showing a compelling profit structure. It was showing a reshuffled income statement that would never deliver sustained profit growth.
Finally, some companies like PayPal disclose a different, yet related metric for understanding input cost intensity called transaction profit. Transaction profit is simply transaction revenue minus costs stemming directly from those transactions. For example, PayPal shares fees with other industry players such as card networks and transaction margin tells us how profitable a transaction is after all mouths are fed.
Operating Expenses & Income: