
Table of Contents
- 1. Datadog (DDOG) – Intro & Earnings Review
- 2. Uber (UBER) – Investor Day
- 3. Coinbase (COIN) – Earnings Review
- 4. DraftKings (DKNG) – Earnings Review
- 5. Earnings Roundup – JFrog; Twilio; DoorDash
- 6. Disney (DIS) – Miscellaneous
- 7. Amazon (AMZN) – Insider Selling
- 8. Meta Platforms (META) – Zuck Video
- 9. SoFi (SOFI) – New Partnership
- 10. Macro
- 11. Portfolio
1. Datadog (DDOG) – Intro & Earnings Review
Datadog is a new name in the Stock Market Nerd coverage network. I wanted to spell out the various pieces of its niche to set the table for future coverage. The firm is a dominant player in the data observability space. Observability simply refers to the practice of monitoring an entire software ecosystem to track issues, vulnerabilities and performance. Other players within this niche include the hyper-scalers, Splunk, Elastic, CrowdStrike (through its Humio acquisition) and many more. Datadog splits its observability niche into 3 smaller buckets: infrastructure monitoring, log management and Application Performance Monitoring (APM).
- Infrastructure monitoring: provides a holistic view of assets like servers and networks. It automates the collection of traffic and overall usage insights. That means it can expediently fix and uncover infrastructure issues.
- Log (or record of event) management: manages “timestamped records of events” occurring across the entire infrastructure. This facilitates faster issue remediation and optimization of performance. These logs are also organized and utilized within Infrastructure Monitoring and other use cases to identify things like customer service issues. Log management encompasses the collecting, maintaining, and leveraging of log data.
- This product routinely supports infrastructure monitoring, BUT there’s a key difference between the two. Log management handles event-based data while Infrastructure Monitoring (as the name indicates) handles infrastructure-based metrics.
- Application Performance Monitoring (APM): tracks app performance and uncovers/prioritizes performance issues to be remediated.
Because Datadog already handles network viability, security is a wonderfully relevant growth adjacency. Products like Cloud Infrastructure Entitlement Management (CIEM) for example, ensure identity controls are strict and minimum access permissibility is in place. It diminishes risk of identity attacks in a cloud environment. Its Security Information and Event Management (SIEM) product allows for “long term data log visualization for security investigations.”
a. Demand
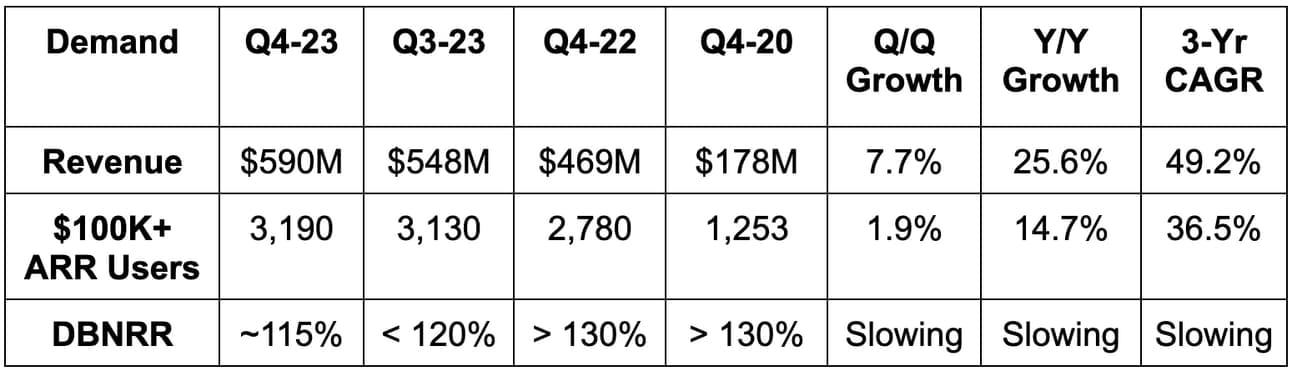
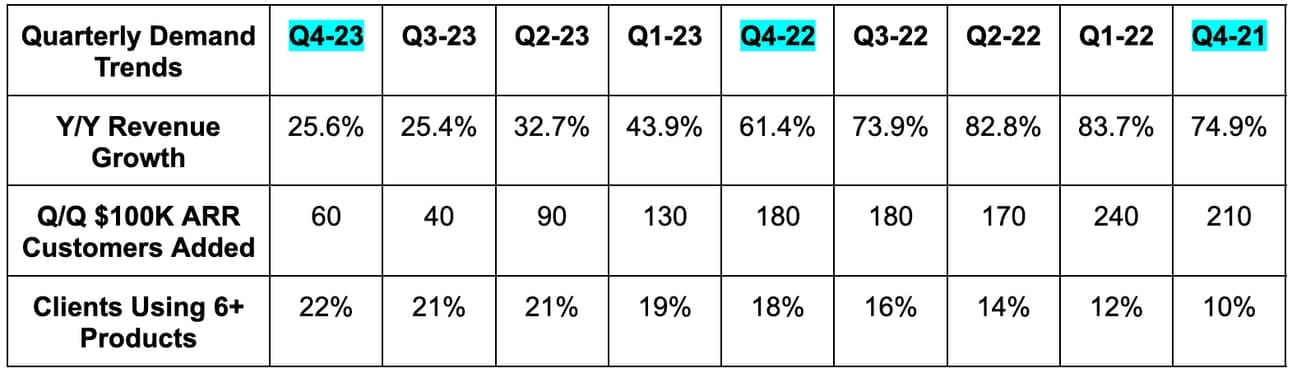
Datadog beat revenue estimate by 3.7% & beat its guidance by 4.2%. Its 49.2% 3-year revenue compounded annual growth rate (CAGR) compares to 52.4% as of last quarter and 53.8% as of two quarters ago. This is the first time in 6 quarters that Datadog’s net new annual recurring revenue (NNARR) rose Q/Q. Billings rose by 35% Y/Y to $723 million, which analysts praised throughout the Q&A.
b. Margins
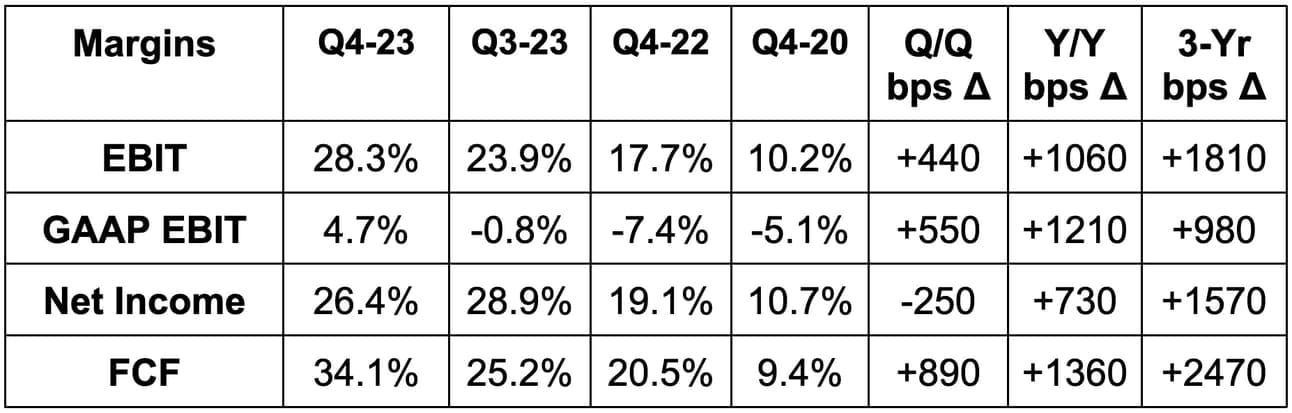
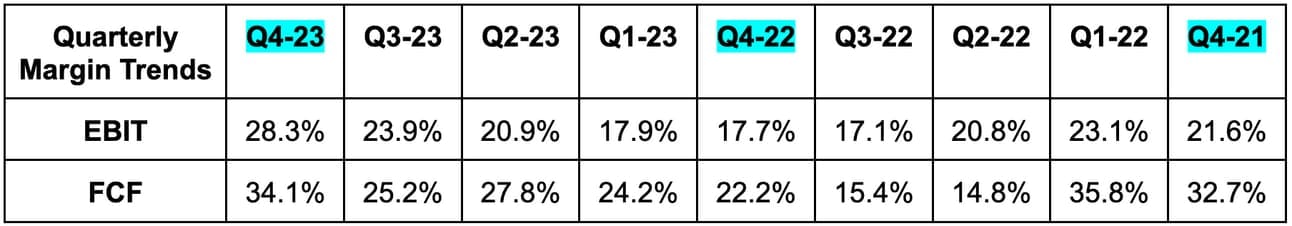
Datadog comfortably beat EBIT (operating income) estimates by 26.0% & beat its EBIT guidance by 27.3%. It met earnings per share (EPS) estimates and its identical guide. Finally, it beat free cash flow (FCF) estimates by 53%.
- Operating Expenses (OpEx) rose 10% Y/Y vs. 17% Y/Y growth last quarter.
- Gross profit margin (GPM) expanded Y/Y and Q/Q due to cloud cost efficiencies.
c. Balance Sheet
- $2.6 billion in cash & equivalents.
- No traditional debt; $742 million in convertible senior notes.
- Basic share count rose by 3.7% Y/Y; Diluted share count rose by 11.2% Y/Y.
d. Guidance & Valuation
Datadog’s 2024 annual guidance was 0.8% light on revenue, 2.0% light on EBIT and $0.37 light vs. $1.78 EPS expectations. It candidly surprised me a bit that the company bounced so quickly following this report. The guide was not what we’ve come to expect from this execution machine, but it does love to under-promise (like every public company should) and the billings result was strong. Furthermore, the miss also reflects a newly shared intention for Datadog to accelerate OpEx growth in 2024. This will lead to margin contraction from 2023 to 2024.
First quarter guidance was slightly ahead on revenue and slightly behind on profitability. CFO David Obstler called January usage results “solid” and better than the rebound the company saw from December to January last year.
Datadog trades for 74x 2024 EBIT and 64x 2024 FCF. EBIT is expected to grow by 15% Y/Y while FCF is expected to grow by 4.2% Y/Y. This slow profit growth is related to the aforementioned intention to lean into OpEx.
e. Call & Release Highlights
Landing & Expanding:
Datadog continues to successfully cross-sell new products to its existing client base. In addition to continued 6+ product traction cited above, its 4+ product customers now represent 47% of total vs. 42% Y/Y; its 8+ product customers represent 9% of total vs. 6% Y/Y. It now has 396 customers with over $1 million in annual recurring revenue (ARR) vs. 317 Y/Y while its customers with over $100,000 in ARR make up 86% of its total business. It calls 42% of the Fortune 500 users, yet only enjoys around $500,000 annually on average from each of them. It sees a large opportunity to briskly boost that number. A big part of that will be Datadog’s continued expansion beyond observability. Encouragingly, its non-observability products enjoyed 75% Y/Y growth (still a small base).
Deal highlights for the quarter included:
- A 9 figure contract expansion with a major global fintech. It will use 15 Datadog products and replace 10+ points solutions.
- A 7 figure add-on deal with a large restaurant chain. It will use 10 Datadog products including its cloud service management.
- An 8 figure expansion deal with a European financial services firm. It will use 14 Datadog products and replace 10 point solutions as the client migrates to Azure.
- A 7 figure deal with a large CPG company also migrating to Azure. It will use 17 Datadog products and replace 6+ point solutions.
Macro & Spend Appetite:
Product usage was stable Q/Q and “played out roughly as expected.” The period of intense cloud optimization from the last 18 months “appears to have dissipated.” It’s seeing these optimizing customers now growing their Datadog usage more quickly than its overall client base. This is a great sign. There’s still some budget scrutiny and sales cycle elongation in the selling market, but it sees “fewer headwinds.”
For more encouraging signs, appetite for signing large, multi-year deals is now coming back as customers re-embrace their cloud and data modernization. All of this has manifested in a stable gross revenue retention (GRR) rate in the “mid to high 90s” (good) and a very strong bookings quarter. As a reminder, bookings are a reliable indicator of forward-looking demand. Finally, churn was also “low and declined sequentially.”
“Last quarter, we mentioned that the larger and more intense optimizers had begun to show signs of stabilization. In Q4, we saw those trends continue and the large optimizers begin to grow again.” – CFO David Obstler
Observability Product Innovation:
Datadog now has 700 integrations within what it calls the “AI stack.” This simply refers to the layers of GenAI, which include model creation, infrastructure powering model training and inference, consumer-facing applications and pre-existing sub-sections like data storage. Datadog integrates with the model, infrastructure and app players and brings its typical data storage niche to the fold. More integrations drive better interoperability within Datadog’s ecosystem, give customers more flexibility and choice of product and foster enhanced usage. More usage means more revenue for Datadog; AI-based integrations rose 75% sequentially.
It also added a new tool called Bits AI this year. This is its assistant to automate insight gleaning from customer behavior and usage patterns. This gives customers the confidence to securely deploy models within Datadog’s surveillance to expedite model innovation. All in all, 3% of its total revenue comes from AI native customers vs. 2.5% Q/Q. It sees this steadily rising over time.
Within the APM (defined above) piece of observability, it launched “Data Streams Monitoring.” This adds APM coverage to streaming and event-driven use cases, which the team told us is a “technically challenging type of workload to cover” for others. It also expedited APM onboarding to allow an engineer to initiate it “across complex apps in minutes.” “Dynamic Instrumentation” was also added to allow engineers to “infuse new logs and metrics” into an app on Datadog’s ecosystem without code changes or redeployments.” All of the real-time malleability; none of the app downtime.
In log management, “Flex Logs” was a big release. This provides a more cost effective means of storing and retaining large batches of data logs. These are priced at just $0.60 per 1 million logs annually and allow for the separation of storage and query costs. This makes the product ideal for long term data storage regulation compliance. Flex Logs easily scales storage and computing in a parallel, independent manner. It’s a similar concept to headless commerce for Shopify and other web builders, which separates front and back-end maintenance. This separation for Datadog unleashes far more data scalability, customization and cost optimization for clients. Conversely, querying from a flex log is slower than for Datadog’s standard log tier. That makes Flex Logs better suited for less frequently needed, lower priority data. Finally, it debuted “Error Tracking Logs,” which can summarize countless coding errors into “actionable reports” with easy steps to debug.
Cloud Security Innovation:
The firm introduced software composition analysis to uncover software vulnerabilities in development. This more deeply entrenches Datadog further “left” in the software development, security and operations (DevSecOps) lifecycle. Further left means closer to actual source code creation. Further right, means closer to software package deployment. Its CIEM and SIEM products (already defined above) debuted, which pushed Datadog’s cloud security customer count to 6,000. It also added a new tool to scan for sensitive data within Real User Monitoring (RUM) events in addition to data logs.
More News:
- Launched its new data center in Japan.
- Secured FedRAMP High Impact Level 5 (IL5) authorization to open it up to more government contracts.
- Added cloud cost management for AWS and Azure customers for more total cost transparency within the public cloud.
f. Take
The quarter was good. The guide was slightly underwhelming for the second time in three quarters. Not terrible, but not great. The platform cross-selling is working, its entrance into cloud security is off to a good start and it continues to rapidly roll-out new innovation. Still, growth is slowing quickly for these types of firms like Snowflake and CrowdStrike, which are also both set to continue delivering more leverage in 2024. Those are basically Datadog’s two most difficult software competitors, but its multiple is in the same ballpark as both. The quarter isn’t a red flag or something to be amazed by.
2. Uber (UBER) – Investor Day
This event walked investors through the structural advantages that Uber has leveraged to distance itself from the competitive pack. Consistent readers have been hearing many of these ideas from me for the last year, but it’s always nice to hear the bullishness reiterated by a candid leadership team. Let’s dig in.
How We Got Here:
Uber’s founder, Travis Kalaniak, was a bit of a crazy person. His mentality was to essentially to “buy growth” at any cost to achieve scale. He ignored profitability, relied heavily on a low interest funding environment and built a massive book of business. He also built a cash incinerator. Three years ago, Dara Khosrowshahi was brought in to turn this sky-high potential business into a lean, mean, fighting machine. Travis built the scale, driver supply, and verb-fueled ubiquity that made Uber special. Khosrowshahi took that massive book of business, streamlined costs, accelerated market share gains and delivered the current margin explosion. Under Khosrowshahi, Uber is growing up.
The two operators are perhaps polar opposites in their approaches to running a business; both have been vitally instrumental (in highly different ways) in getting Uber to this point. The mad man jump started the growth engine; the operator perfected it.
Product Breadth & UberOne:
Uber’s ability to cross-sell more products than its customers means its customer acquisition cost (CAC) is lower than everyone else’s. Adding a second product to a consumer’s monthly routine, for example, lowers its average CAC by 50%. 34% of its monthly active users (MAUs) now consume multiple Uber products vs. 21% as of its 2021 investor day. These consumers spend 240% more on average than single product users. Notably 31% of its new delivery customers come from mobility (i.e. ride sharing) and 22% of first time mobility users from its delivery app. This promising trend makes Uber’s growth very efficient.
Higher lifetime value (LTV) paired with lower CAC leaves us with a book of business at better margins and with more margin upside than any competitor.
Summary of the playbook:
- Delight customers with lower surcharge rates and wait times than others (thanks to its leading driver scale).
- Give these customers more reasons to use Uber with its more diverse use cases.
- Tie all of the utility into its UberOne subscription to drive the more valuable, more efficient, more successful marketplace. Speaking of UberOne:
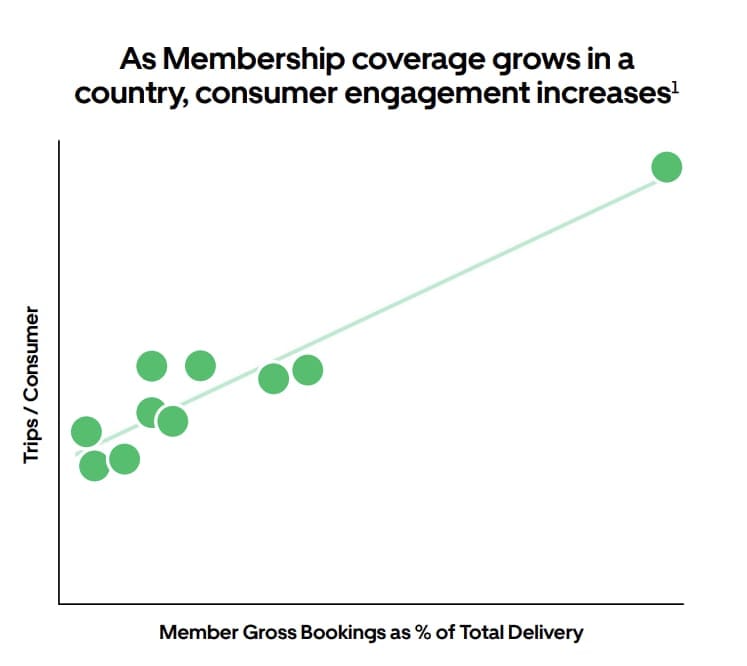
UberOne members deliver an even larger spend advantage vs. multi-product users and the subscriber base crossed 19 million in total this quarter. The subscription now represents 30% of its total volume, and as that grows, engagement rises and revenue quality rises with it. Data scale also increases as it collects data from more highly engaged members. That sharpens Uber’s discovery algorithms. The sharpening allows it to surface the right promotion/advertisement and to optimize incentives.
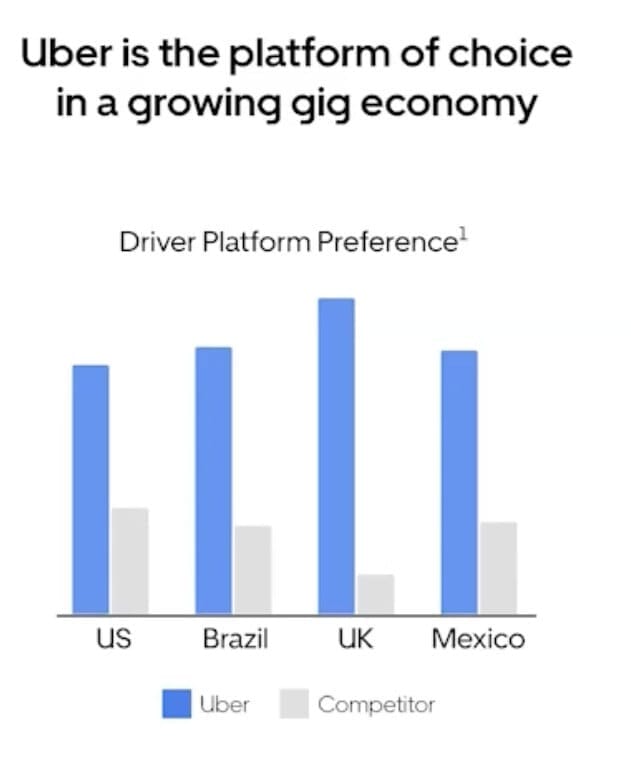
The structural advantage of Uber’s business offering also extends to its driver supply. Retention and engagement both get large boosts for drivers fulfilling mobility and delivery requests. Maybe that’s why the majority of workers prefer to drive for Uber vs. others. Or maybe it just comes down to more demand and less down time.
Shared Tech Infrastructure:
Uber has 150 million MAUs for a massive base of built-in traffic. This is why it seamlessly launches new products basically every quarter and sees most of them race to $1 billion+ in volume so quickly. Importantly, about 75% of the infrastructure needed to stand-up a new product comes from shared, existing engineering resources and products. This is a powerful infrastructure network effect that mimics its driver and consumer network effects. It significantly cuts product launch cost and time and allows new offerings to utilize all of the data and learnings that the existing, scaled products have available to offer.
All of its microservices (like fraud or payments or customer service) making up its tech stack were also built on the shared infrastructure. This means each piece borrows value from the others in a “better together” fashion. Unsurprisingly, this pulls from Uber’s work and partnerships within AI models. Its leading first party data scale allows these models to be more effectively seasoned while Uber’s backend allows this seasoning to foster value creation across all use cases.
Mobility Highlights:
30% of Uber’s mobility trips are non-UberX trips vs. 15% as of 2021. It’s effectively rounding out the mobility suite to cater to all communities from frugal to affluent. Its Moto service, for example, is 50% cheaper per mile than UberX and is gaining rapid momentum in India and Brazil. On the other end, its Reserve product is allowing it to finally penetrate affluent suburban areas where 75% of those requests originate. Uber has a leading category position in all 10 of its largest markets and almost every one of its top 70. Tools like upfront fares, earnings heatmaps and safety features continue to push more drivers to Uber than anyone else. Again, Uber’s product suite, paired with best-in-class service, keeps that supply lead growing.
- In 2021, it spoke about difficulty entering Spain, Germany, Korea and other important markets. Fast forward to today and those markets are now “rocking” as they cross a $3 billion volume run rate for 2023 vs. $1 billion in 2021.
- Despite all of the success to date, leadership sees mobility as in the early innings. Penetration is still under 20% of eligible adults in its most mature markets; 90% of airport rides still aren’t using Uber; Uber for Business (and its 170,000 customers) is just 10% penetrated in its serviceable addressable market (SAM); Uber for Teens is still brand new. The runway is still very long.
Delivery Highlights:
Uber now has a top share position in 7 of its 10 largest markets and took market share in all ten of them in 2023. Since 2021, this business has gone from -$600 million in EBITDA to $1.5 billion in EBITDA while compounding at a rapid clip. The biggest growth opportunity for delivery (aside from being only 15% penetrated in its SAM) is to transition annual users to monthly users. Just 35% of annual users order from delivery at least monthly. The other opportunity is better custom service as it looks to build on its 25% Y/Y reduction in incomplete delivery trip rate.
Notably, 14% of its delivery customers are now using grocery and retail vs. 8% in 2021. Users of both spend 3x what users of one product spend as Uber seamlessly upsells a bottle of wine with dinner, for example. This cross-selling, along with better efficiency, AI investments and more scale, led to the profit explosion for the segment. Consumer incentives are down; cost per trip is down; consumer fees as a percent of basket size are down; all costs are down.
The Business Platform:
- Uber Direct (white label fulfillment service) for businesses has compounded volume at an 87% clip since 2021. It has welcomed McDonald’s, Apple, Walmart and many other brands to what it calls its “most nascent bet.”
- Retailers are increasingly utilizing it to offer free rides for their power shoppers.
- Healthcare systems are using it for non-emergency transportation.
- It’s now at 100 million annualized trips.
- The $900 million advertising business is poised to morph into a “multi-billion dollar business.” Uber has fantastic customer data on where they want to go and what they want to get. This precisely guides targeting to deliver Uber’s 8x return on ad spend. Ad revenue will be very margin accretive.
- Dara teased entering “more adjacencies where we think we have a strong right to win” in enterprise services and advertising.
The Financial Targets:
Now… onto what we were all waiting for… robust multi-year financial targets. These targets simply reiterate how special Uber is. There are not many that can compound the top line at a near 20% at this scale and with this margin trajectory.
First and foremost, Uber announced the buyback it has been teasing for almost a year. Its balance sheet is quickly entering investment grade credit status and its cash flow printer is fully turned on. Furthermore, it has $6 billion in investments that it will look to partially liquidate over time to build the cash pile further. So? It announced a $7 billion buyback. CFO Prashanth Mahendra-Rajah told us the buyback would initially offset dilution as it ramps to a point of consistently shrinking share count.
For the next three years, Uber guided to a "mid-to-high teens" volume CAGR vs. 14.8% CAGR expectations. It guided to a “high 30% to 40%" EBITDA CAGR vs. 36.5% CAGR expectations. Finally, it conservatively guided to $9.6 billion in 2026 FCF vs. $8.2 billion consensus. This FCF estimate assumes 90%+ EBITDA to FCF conversion means 90% and that the EBITDA CAGR assumption means 38%. These targets put a large smile on my face.
One more interesting note. In the presentation, Uber proudly proclaimed that it has “met or exceeded bookings and EBITDA expectations for 8 straight quarters.” This tells me how closely they watch consensus estimates and how intentionally they only set targets they can beat. They know exactly what the street wants from them.
In conclusion, this was a great showing. Enough said.
Long-Term Mindset is a FREE weekly newsletter emailed each Wednesday. Each issue contains five pieces of timeless content to encourage you to think long-term. All issues can be read in less than 1 minute. There’s a reason why we are consistent readers and think you should be too. Subscribe here.

3. Coinbase (COIN) – Earnings Review
Coinbase is a dominant, leading crypto exchange. Its results are violently cyclical as retail volume is highly volatile and drives a large portion of their results.
a. Demand
Coinbase beat revenue estimates by 16.5%. For the full year, revenue fell by 3% Y/Y due to transaction revenue declines. Subscription and services revenue rose by 78% Y/Y.