
Crazy 5 days. In case you missed it, I published the following pieces during the week:
- PayPal & Airbnb Earnings Reviews
- Shopify & Palantir Earnings Reviews
- SoFi Earnings Review
- Apple & CloudFlare Earnings Reviews
1. Pinterest (PINS) – Earnings Review
a. Demand
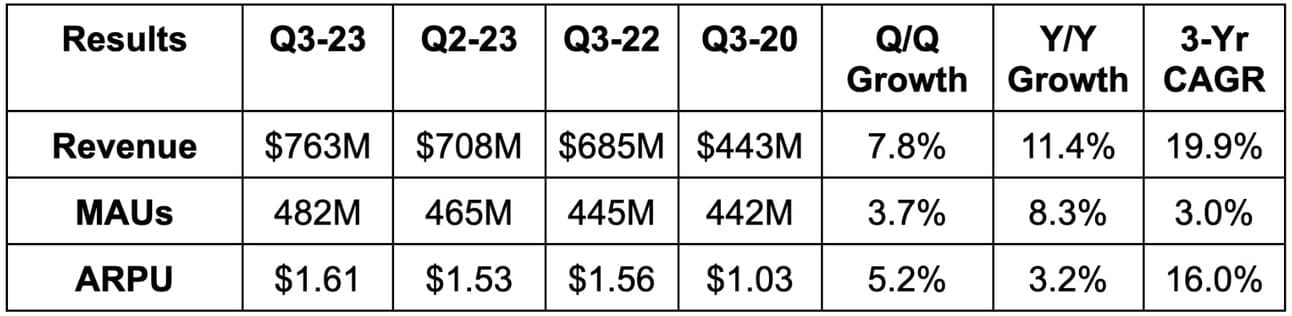
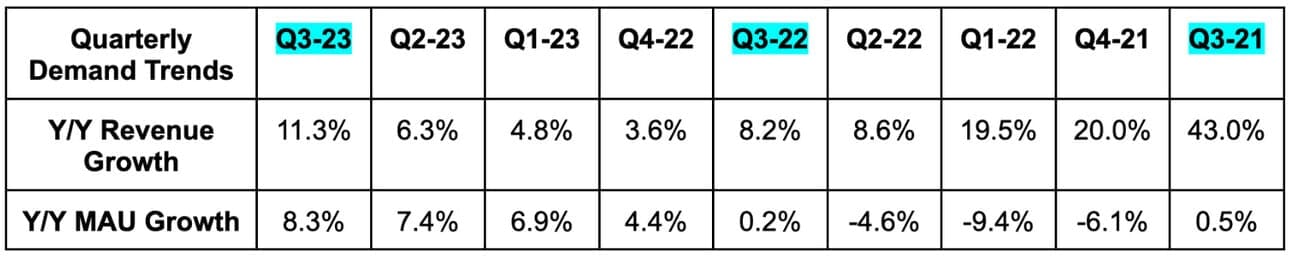
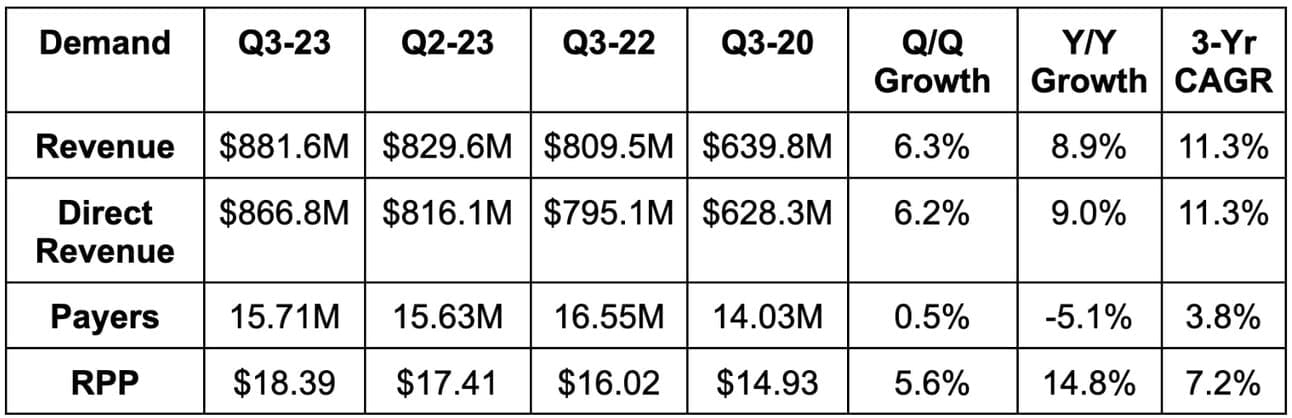
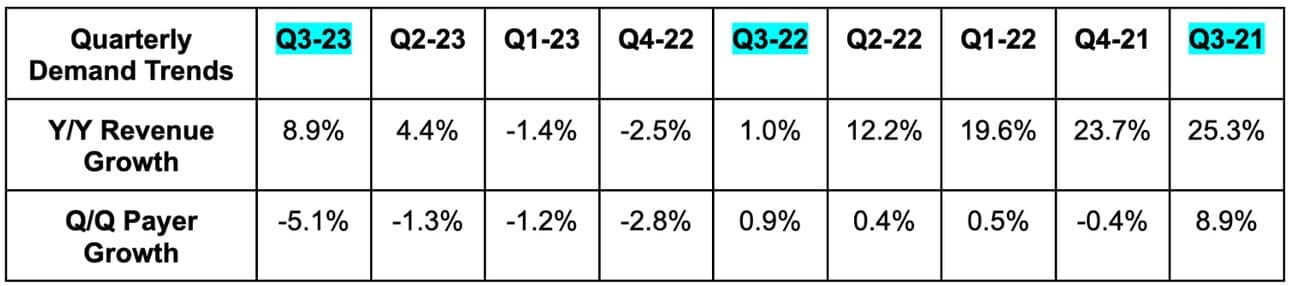
- Pinterest beat revenue estimates by 2.7%. Its 11%+ Y/Y revenue growth also beat loose guidance of 7.5% growth.
- 19.9% 3-yr revenue compounded annual growth rate (CAGR) compares to 37.5% Q/Q & 30.4% 2 quarters ago.
b. Profitability
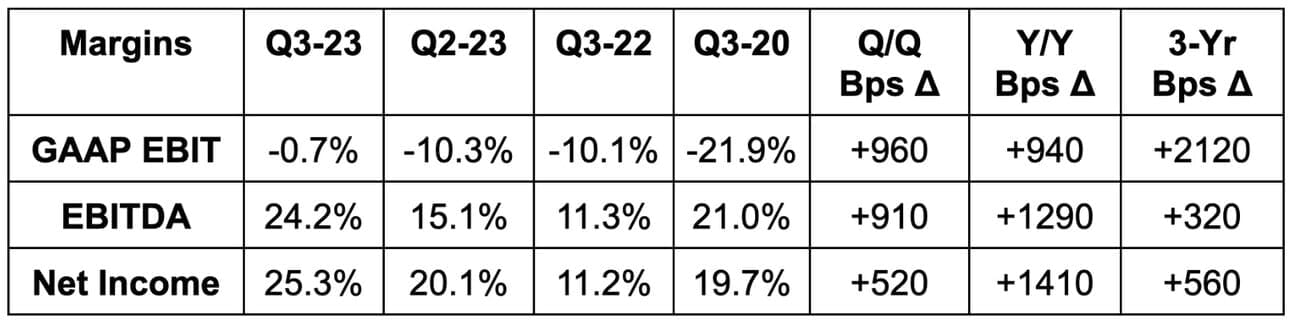
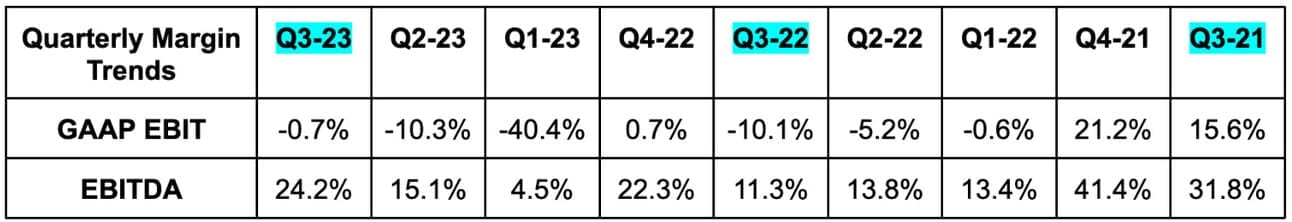
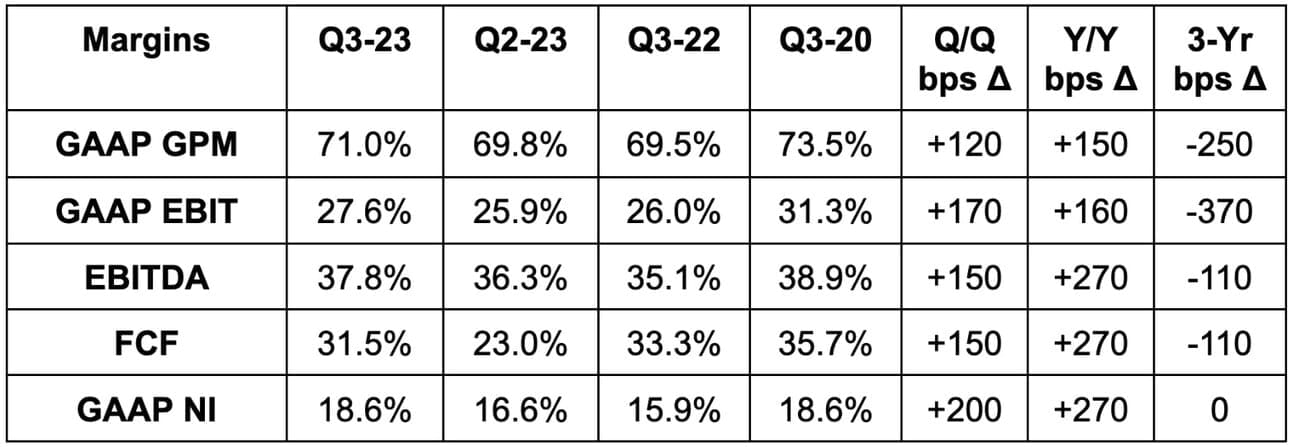
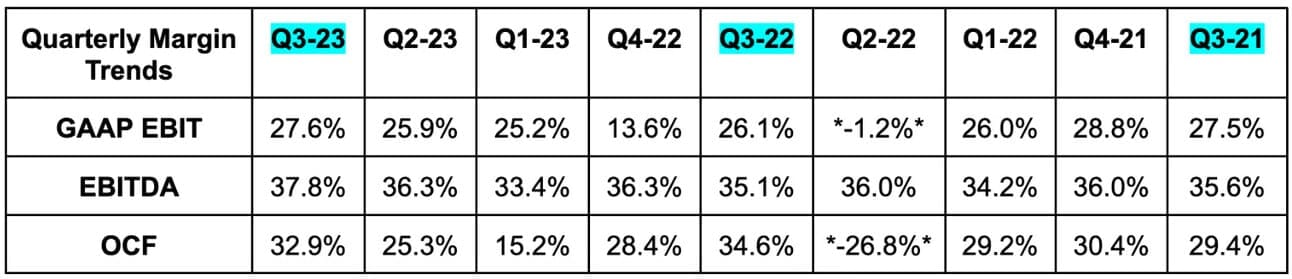
Pinterest beat EBITDA estimates by 42.4%. It also beat $0.20 earnings per share (EPS) estimates by $0.08. Its $0.01 in GAAP EPS beat estimates of -$0.03 by $0.04.
Please note that EBITDA is often higher than net income because of the firm’s strong balance sheet and the coinciding interest income.
c. Guidance
Pinterest’s revenue guidance beat estimates by about 1% at the midpoint.
It now sees 600 bps in EBITDA leverage for the year vs. 400 bps as of last quarter & 200 bps at the start of 2023.
It also reiterated the long term targets offered at its Investor Day last month. These include mid-to-high teens revenue growth and reaching a 30% EBITDA margin over the next 3-5 years.
d. Balance Sheet
- $2.3 billion in cash & equivalents.
- Diluted share count rose 2.7% Y/Y but basic share count was flat Y/Y. It bought back $500 million in stock for the quarter.
e. Call & Release
Succeeding:
Pinterest strength was broad-based and structural in nature. Growth was faster than it’s been in over a year as comps got easier and engagement outperformed. New cohorts are saving 100% more content in their first year on the app vs. older cohorts. More content saving means more time spent. Leadership thinks it has struck the best “product market fit in years” with results being the effect.
Encouragingly, its strongest engagement by age demographic is with GenZ. That’s its fastest growing cohort in terms of MAUs as well as time spent.
Consumer-Facing Product Innovation:
Pinterest launched its “more ideas tab” on the home feed this quarter. The tool works conceptually similarly to content pinning on other social media sites. It allows users to select themes and “quickly refocus” on the content categories that speak to them. Pinterest exists to “save and curate ideas to make, do or buy in the future.” This release directly creates more relevant and engaging feeds to motivate saving. It should theoretically be an engagement tailwind if done correctly.
Along similar smart discovery lines, Pinterest debuted another tool this quarter. It scrapes the search history of users to display more interesting content as they scroll. It can use this data to “resurface relevant pins” as well. Non-follower content discovery is among the most impactful boosts to Meta’s engagement at the moment. Pinterest is sort of emulating that here. It calls this “guided browsing” and expanded the successful pilot project across North America this quarter.
It also debuted its “Shop the Look” module to help users quickly enter commerce mode and engage with shoppable links. This likely won’t be a direct engagement booster, but could help with ARPU. That’s the aim of this specific release. Shopping is actively becoming a more central piece of the user experience.
Advertising Innovation:
Pinterest revealed “mobile deep links” (MDL) earlier in the year. These links take app users right to a merchant’s mobile app with a single click. Since being released, MDL has boosted conversion for ad buyers by 235% while lowering cost by 35%. Now, it’s borrowing MDL’s success to debut a related product called Direct Links. Direct Links take clickers right to a merchant’s webpage (vs. mobile app for MDL). Both of these products remove steps/clicks in the shopping process to juice conversion. That juicing directly props up the value of Pinterest’s ad impressions.
Advertisers can easily create links and run cost per click campaigns through Pins’s platform. To date, 60% of its lower funnel (closest to conversion) revenue is through Direct Links. That represents 40% of overall revenue generation. It will roll out the tool to the rest of its lower funnel use cases like video ads by the first half of next year. So far, Direct Links deliver an 88% higher click through rate at 39% lower cost per click vs. its predecessors.
Premiere Spotlight (video ad format displayed at the top of pages) expanded from just the search tab to the home tab as well this quarter. For Maybelline in Canada, this product doubled its video completion rate vs. other campaign types.
Application Programming Interface (API) for Conversion is its tool to allow advertisers to add their old campaigns and conversion data to their Pins campaigns. The company added Adobe’s Commerce suite and Salesforce Commerce Cloud this quarter to bolster data usability for ad buyers. For PacSun specifically (a Salesforce customer), this news allowed it to accelerate Pinterest marketing campaigns. On Pinterest, with direct access to its 1st party data, it enjoyed a 700% boost to attributed conversion.
This API solution touches 28% of total Pinterest revenue as of August 2023 vs. 14% at the end of 2022. Along similar data leveraging lines, Pinterest extended its consumer data history profile to include older conversions and search activity. This is lowering cost per impression thanks to the added data infusion.
“By utilizing AI and large language models, we were able to more precisely link product metadata to user queries to show ads that are more relevant.” – CEO Bill Reddy
The firm now allows Amazon to display sponsored listings from its marketplace right on Pinterest as part of a 3rd party ad partnership. This is “off to a great start” per leadership. The most noticeable boost to revenue from this new Amazon partnership (and related relationships) will be in the first half of 2024. According to CEO Bill Reddy, the “upfront work to integrate 3rd party demand” is done. This has freed them to embrace many more 3rd party data source integrations to bolster targeting and interoperability.
Generally speaking, it continues to open up larger portions of its pages to ad placements. Growing ad load, all else equal, will also help with monetization. This led to 26% Y/Y ad impression growth.
Macro:
Ad pricing remains pressured by macro. Still, it’s showing “signs of stabilization” as pricing fell 12% Y/Y vs. a 20% Y/Y decline last quarter. This trend and commentary closely echo what Meta told us this quarter. Consumer packaged goods, retail and surprisingly financial services were the ad demand standouts this quarter.
Important Metrics:
- Revenue rose by 8% Y/Y in North America, 33% Y/Y in Europe and 29% Y/Y in the Rest of the World.
- MAUs rose by 1% Y/Y in North America, 7% Y/Y in Europe and 12% Y/Y in the Rest of the World.
- Operating costs shrank across all key buckets while revenue growth accelerated. Good combination. Specifically:
- Research & Development (R&D) fell 8% Y/Y.
- Sales & Marketing (S&M) fell 2% Y/Y.
- General & Administrative (G&A) fell 3% Y/Y.
f. Take
Billy Reddy has righted this ship. This was the best quarter Pinterest has reported in a while; forward commentary points to this becoming a new trend. User growth and engagement are very promising, especially with it being powered by GenZ. The sharpened focus on ad-tech investments and commerce leaves a lot of upside for ARPU. These investments are taking place while margins explode higher. That’ll work.
2. Match Group (MTCH) – Earnings Review
a. Demand
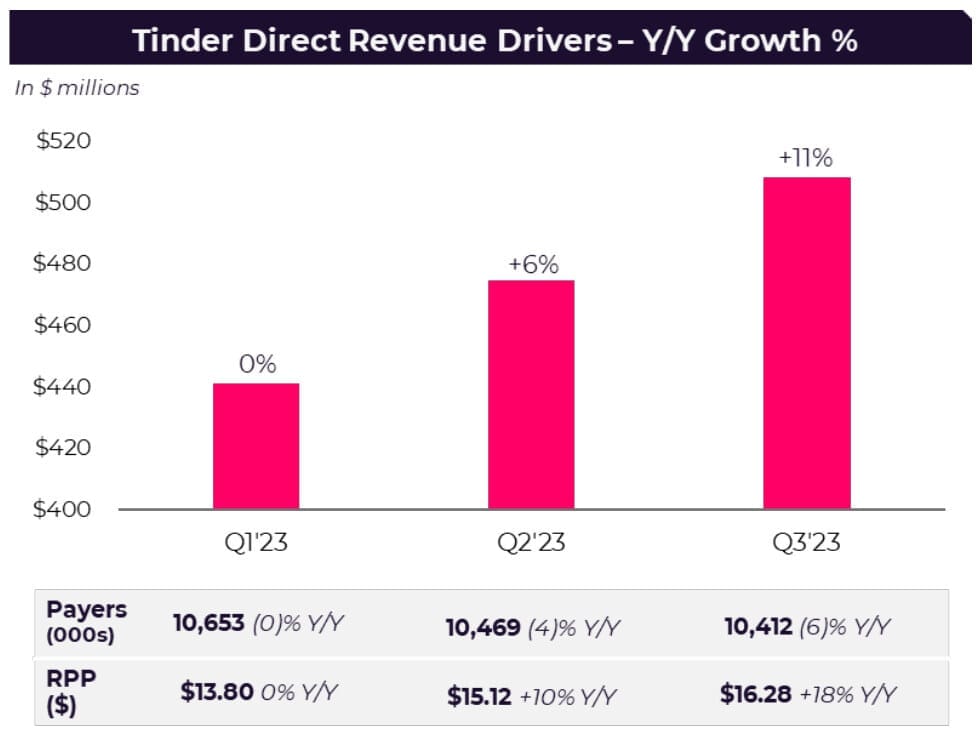
Match beat revenue estimates and its guide by a very slim margin. This was despite $10 million more in FX headwinds than expected. Tinder grew 11% Y/Y while Hinge grew 44% Y/Y. Payer growth was worse than expected.
b. Profitability
Match beat EBITDA estimates by 0.6% and beat its EBITDA guidance by 3.3%. Its gross margin came in slightly ahead of expectations as well.
c. Balance Sheet
- $713 million in cash & equivalents.
- $3.8 billion in total debt.
- Share count fell 2.2% Y/Y.
Match Group has a 3.0x net leverage target. It’s safely below that at 2.7x, but may look to push it down further in today’s elevated cost of capital environment. Still, this is not stopping its rapid buybacks. The company has a goal of returning 50%+ of free cash to shareholders. It has already repurchased $445 million this year with expected free cash flow (FCF) of $800 million. Despite already exceeding that, it’s a “target not a limit.” Match expects to keep buying back more shares while also driving down its leverage. FCF is set to grow further in 2024, which should lead to more buybacks in the future. For now, it has $667 million left on the current plan.
d. Guidance
Match Group missed Q4 revenue estimates by 3.8%. This was related to two factors. First, foreign exchange headwinds removed $27 million from the guidance. It also took out a chunk of the expected $7 million in Israel revenue due to the ongoing war. Macro related advertising headwinds took another $3 million off of the guide. Without these headwinds, revenue guidance would have been just ahead of estimates. The guidance “reflects the risk of business deterioration due to weakening macro as well.” It seems to be quite conservative. The company reiterated its goal of 2023 EBITDA margin leverage.
The FX related weakness and geopolitical issues don’t bother me. The commentary around poor macro and ad demand hurting its business did bother me a lot. We’ve heard countless other consumer-facing companies fare far better this quarter. Match could just be blaming exogenous factors to its fundamental struggles.
For 2024, Match preliminarily guided to 8%-9% Y/Y revenue growth. This is worse than the 10.5% Y/Y growth expected, but includes a 200 bps foreign exchange headwind. It sees payer growth improving all year and Hinge growth remaining very lofty. It guided to “at least stable” EBITDA margin which is slightly worse than the 70 bps of EBITDA margin leverage analysts expected. It now expects Tinder’s return to double digit growth to only last 3 quarters before falling back below 10%. Really not good. The 2024 guidance also bothered me quite a bit.
e. Call & Letter Highlights
One Year into Kim’s Tenure:
Bernard Kim took over with the goal of vastly accelerating and improving product execution and innovation. He set the target of re-accelerating Tinder to 10%+ Y/Y growth by Q4. He hit that goal a quarter early… although in a temporary fashion. Marketing initiatives continue to gain traction and, when paired with product releases, set Tinder up for a strong 2024 per the team.
He set the ambition of making Hinge a globally known name through international expansion. Fast forward to today and it ranks #1 in new downloads across key markets like the U.K., Australia, Sweden and Ireland. It’s top 3 in 12 countries already while the app set new download records this quarter. Within Match Group Asia, he set out to turn the Azar app around. The app delivered 20%+ Y/Y growth for the second straight quarter. Finally, he worked to trim redundant costs and consolidate the tech stacks of its evergreen apps into one. This has already led to material cost savings to re-allocate to higher priority apps.
Weekly Subscriptions & Top of Funnel at Tinder:
As expected, payer growth remained negative Y/Y, but actually modestly rose Q/Q. This is the result of price hikes that are still being implemented throughout North America. This is why revenue per payer (RPP) rose by a brisk 18% Y/Y for the app.
Payer growth is supposed to be worse in Q4 and to improve throughout 2024. This is partially because Tinder enjoyed a payer boost in Q2 and Q3 from debuting weekly subscriptions across North America and Europe. This tailwind quickly normalized as these types of subscribers churn more readily. It will not enjoy the same pent up demand from weekly sub launches in Q4, but will deal with the elevated churn. This factor will subtract 200,000 payers from Tinder’s base Q/Q. It remains adamant that weekly subscribers are a good idea and thinks the added payer volatility will normalize by 2024.
Tinder restarted college campus marketing after a 3 year break. It ran a “Swipe Off Challenge” which awarded the most engaged university (Arizona State) with a free concert. This campaign raised swipe volume by 10%+ across the 20 most active schools. It pulled back on the “It Starts with a Swipe” campaign to allocate more dollars here. This was another source of Payer weakness.
Pulling back on a successful marketing campaign mid quarter was confusing and frustrating to me. Match was supposed to be cutting costs elsewhere to be able to liberally spend on Tinder. The pause led to increasingly weak user trends throughout the summer and fostered the negative Q4 payer commentary. Importantly, there was no decline for 18-29 year old women. This is its most important demographic for improving ecosystem health.
So far, 60% of Tinder’s payers have seen their prices hiked. Continued rollouts will keep hitting payer growth, but these new headwinds are concerning. It hints at the team just offering an endless series of excuses for why its most important app is in decline. Yes, the app is accelerating growth, but that’s due to easier comps. All of these excuses and the guidance point to the acceleration being short-lived.
Other Apps:
- Hinge payers rose 33% Y/Y to 1.3 million with RPP up 8% Y/Y to $27.
- Match Group Asia revenue fell 5% Y/Y as Hakuna and Pairs weakness offset Azar’s recovery. Azar will expand to Europe and the U.S. over the next year.
- Emerging and Evergreen (E&E) fell 3% Y/Y overall while Emerging brands rose 40% Y/Y. Cost controls continue to be priority one for its legacy brands.
The initial reception to Archer (gay dating app) was very strong. It’s now #2 in the U.S. gay dating category and quickly catching up to #1. Archer downloads are already over half of Grindr’s despite it just being released (with little marketing spend).
Expense Discipline:
Operating expenses as a percent of revenue fell 200 bps Y/Y. By specific bucket, S&M intensity rose 100 bps Y/Y, G&A intensity fell 200 bps Y/Y and R&D was flat Y/Y.
Google Settlement:
Google and Match settled their lawsuit stemming from in app payments. As part of the agreement, the $40 million Match left in an escrow fund will be returned to it. Match will implement Google’s User Choice Billings by March 2024. It will pay the standard 15% subscription and 30% a la carte take rates to Google when Google’s payment processing is utilized. It will pay 11% and 26% for subscriptions and a la carte when it isn’t. This is not expected to lead to input cost relief for Match as it will pay incremental costs under the deal. Still, a “value exchange agreement” will allow it to recover all of those incremental costs from Google. This is essentially a wash, but makes that mega cap tech player less of an enemy.
f. Take
This quarter was bad. It materially diminishes my confidence in the new team turning this company around and leaves me quite underwhelmed. Blaming exogenous headwinds on poor guidance does not work when others are offering more upbeat forward prospects. That points to Match’s issues being specific to Match and not truly via macro. Old excuses are being replaced with new excuses. Too many excuses.
Geopolitics and a strong dollar are out of Match’s control. I don’t blame them for these headwinds leading to the light Q4. Still, the commentary on hefty weekly subscriber churn, top of funnel weakness and no signs of a Japan recovery is concerning. The talk about advertising weakness is also concerning considering we’ve consistently heard others call the environment “stable.” Just not great all-around. Somewhat understandable, but still irksome. I was expecting the FX issues, but not the others that surfaced.
This position is already full for me, so I could not add even if I wanted to. Thankfully, I don’t want to. Payer growth needs to return to positive territory like it’s supposed to and the Tinder turnaround needs to continue to gain steam. If the team is still making excuses for why it’s struggling after the first half of 2024, I will likely exit. I’m still considering exiting earlier than that after this poor showing.
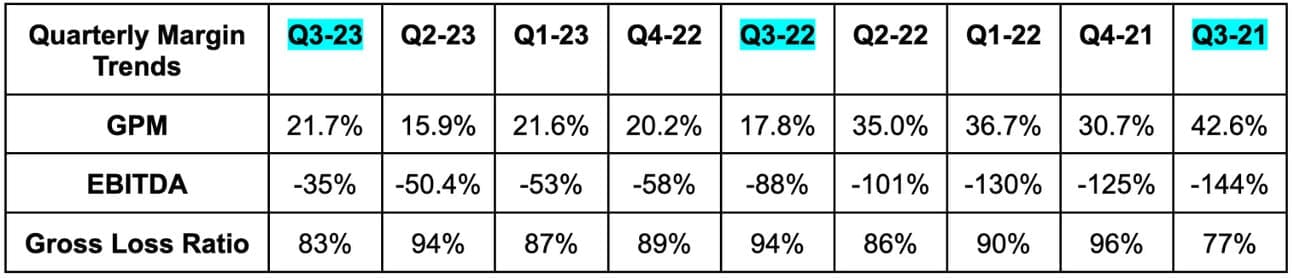
3. Lemonade (LMND) – Earnings Review
a. Demand
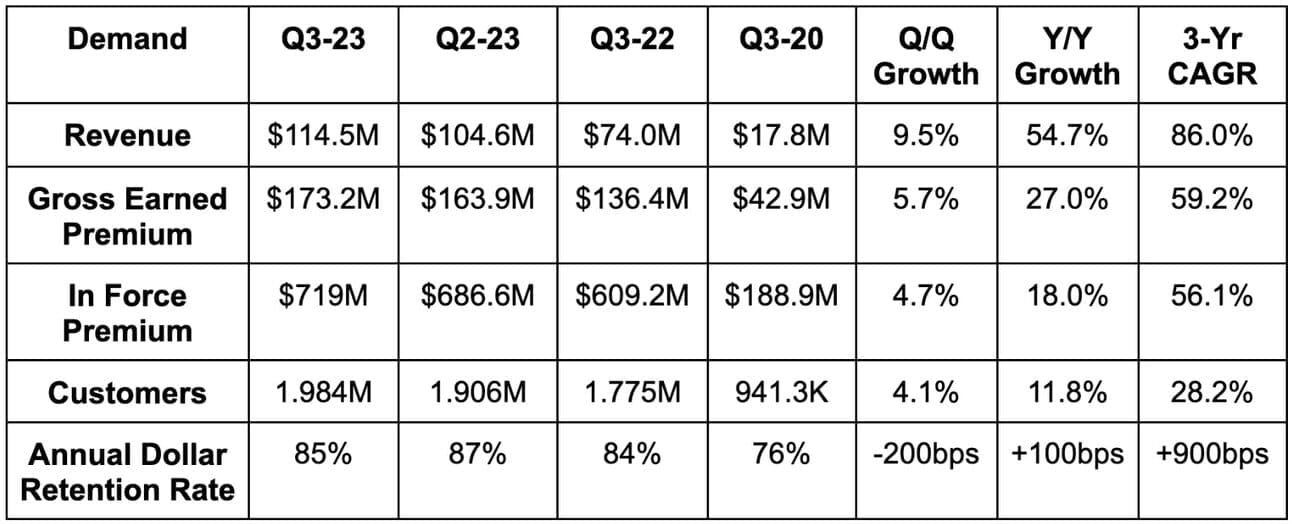
- Beat revenue estimates by 9.3% and beat guidance by 11.2%. Its 86% 3-year revenue CAGR compares to 51.8% Q/Q and 53.7% 2 quarters ago.
- Revenue growth was aided by 169% Y/Y growth in investment income and a lower ceded premium rate.
- It ceded 50% of premiums to reinsurers vs. 63% Y/Y.
- Beat in force premium (IFP) guidance by 2.0% and beat gross earned premium (GEP) guidance by 3.7%.
b. Profitability
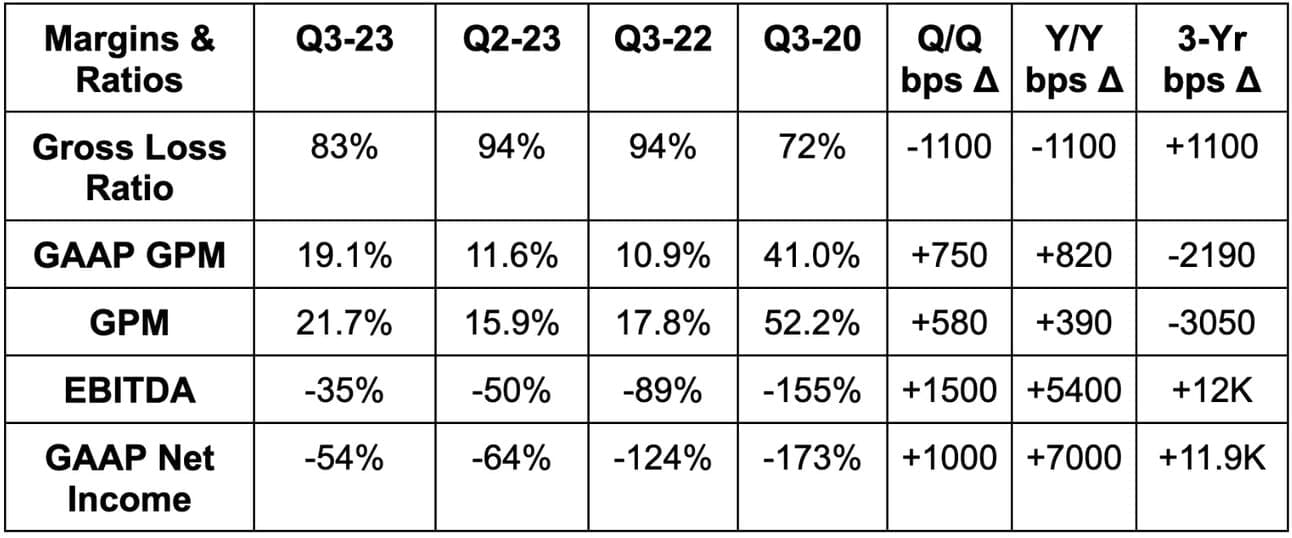
- Beat EBITDA estimates by 19.0% & beat EBITDA guidance by 19.6%.
- Beat GAAP EBIT estimates by 8.0%.
- Beat -$0.94 GAAP EPS estimates by $0.06 representing a 6.4% net income beat.
Please note that lower gross loss ratio is a good thing & vice versa. Also note that the sharp 3-year decline in gross margin is related to ceding a lower proportion of its premiums to reinsurers.
c. Q4 Guidance
Lemonade beat revenue estimates by 1.0% & beat EBITDA estimates by 1.2%.
As part of the call, Lemonade revisited previously issued financial targets from its investor day 12 months ago. The team now expects to turn free cash flow positive in 2025 vs. 2026 previously. It expects to reach this milestone with “hundreds of millions in unrestricted cash” vs. $100 million previously. It’s finally showing clear signs of future profitable compounding. Over the last 2 years, GEP has increased by more than 100% with operating expenses (OpEx) up 19% during that time. This quarter, OpEx kept falling with -11% Y/Y growth.
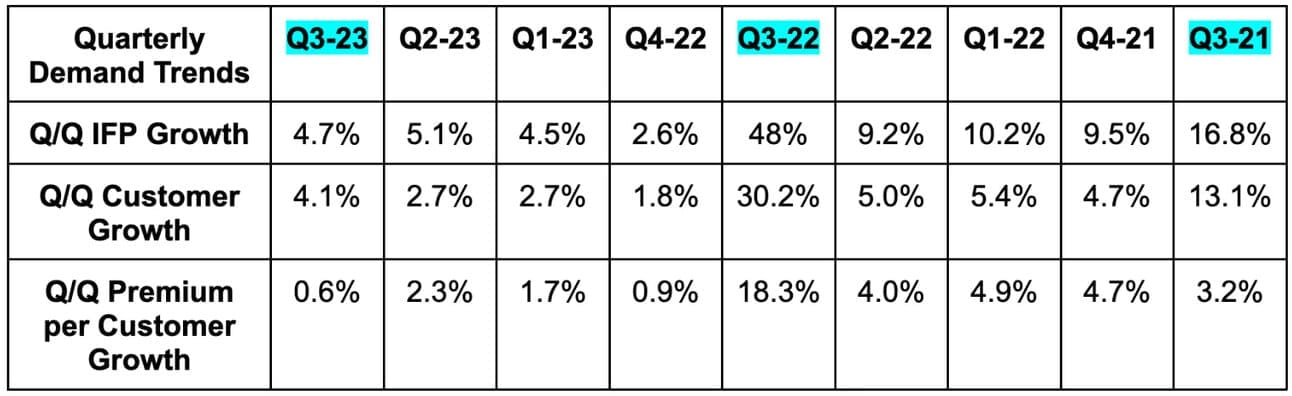
As it enjoys more rate filing approvals (covered below), it’s also ready to lean back into faster growth. Along those lines, it sees 18% Y/Y premium growth accelerating back to 25% next year.
d. Balance Sheet
- $945 million in cash and equivalents.
- $109 million carried by insurance subsidiaries as policy reserves.
- No debt.
- Share count rose by 4% Y/Y. This must slow like it’s expected to.