Today's piece is presented by FTX.US:

1. Progyny (PGNY) -- Earnings Review
“These strong results demonstrate that our member activity has returned to the levels we typically expect to see. Based on what we see, we believe that the impact of the Omicron variant is behind us.” — CEO Peter Anevski
a. Progyny Demand
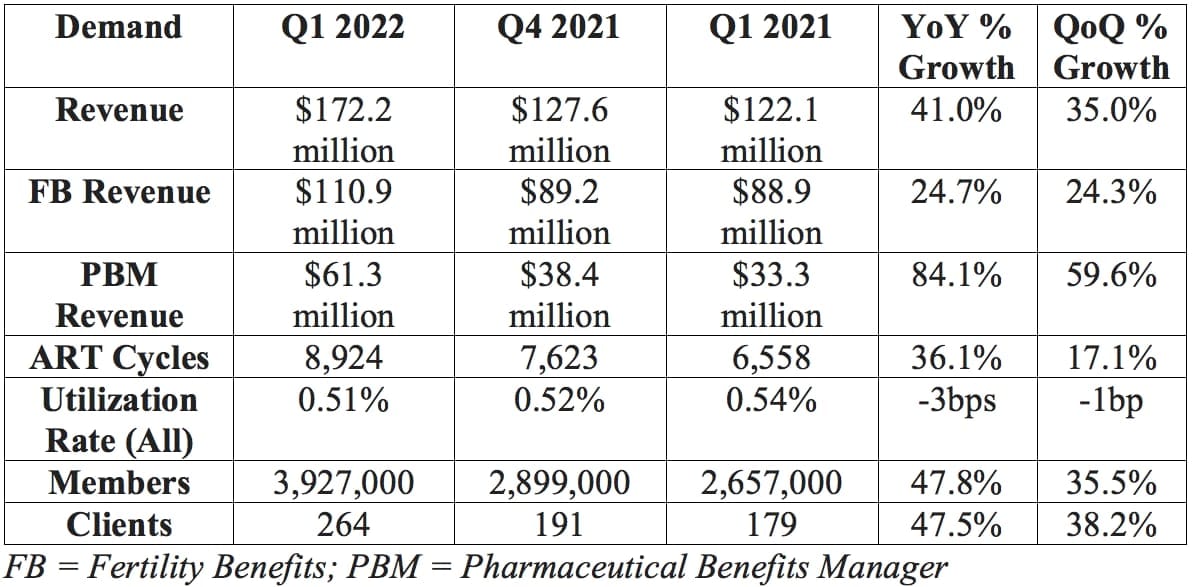
Progyny guided to $167.5 million in revenue with analysts expecting $167.2 million. Progyny posted $172.2 million, beating its guide by 2.8% and analyst estimates by 3.0%.
More context on demand:
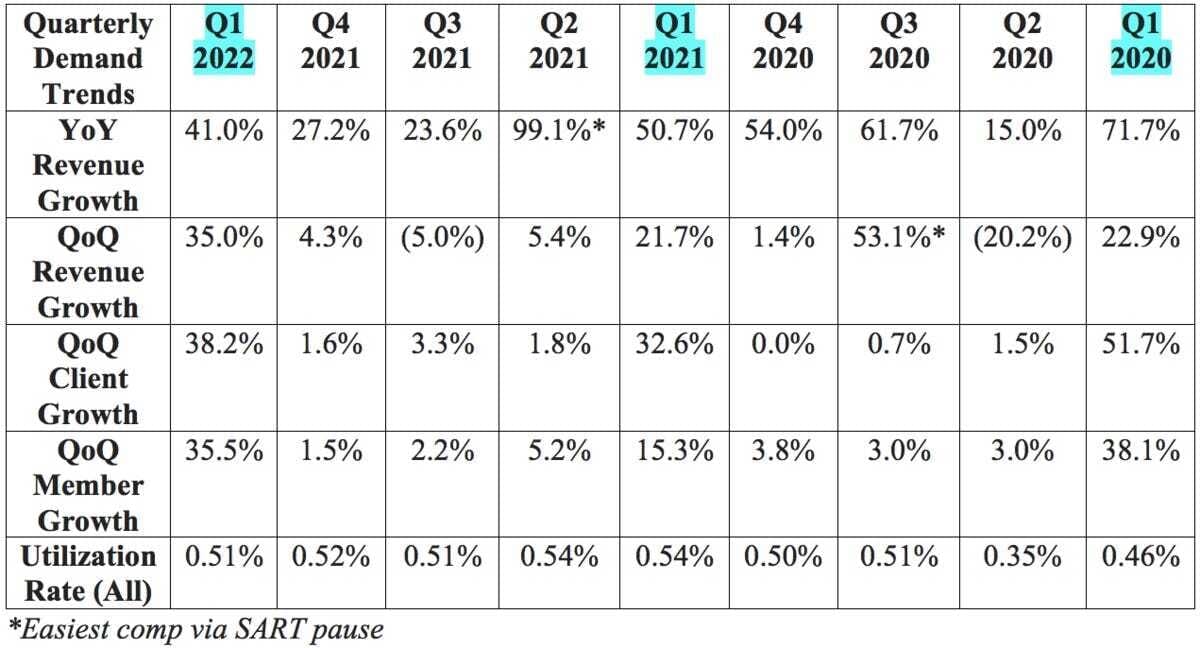
- Note that The Society for Reproductive Assisted Technology (SART) suspended all new fertility treatment cycles (so a large portion of Progyny’s revenue) in Q2 2020 with that suspension ending in Q3 2020.
- The first quarter -- with normal comps -- is always Progyny’s best sequential quarter for growth. This is due to selling season wins usually going live at the beginning of the following year.
- As this is not a SaaS/recurring revenue business and does have some real seasonality to its results, it makes the most sense to compare growth rates to the same quarter from previous years.
- This was the largest sequential step-up in volumes in company history
b. Progyny Profitability
Progyny guided to a midpoint of $24 million in adjusted EBITDA for the quarter while analysts were hoping for $24.5 million. Progyny posted $24.8 million, beating its expectations by 3.3% and analyst estimates by 1.2%.
Progyny also guided to a loss per share of $0.02 with analysts expecting the same. This guide did not include any deferred tax benefits which Progyny enjoyed during the quarter. This resulted in earnings per share of $0.05.

More context on margins:
- Q1 2022 and Q4 2021 gross margin compression was powered by the newly issued stock grant that Progyny disclosed last quarter. Q1 2022 and Q4 2021 gross margins would have been 22.7% and 23.4% respectively.
- Gross margin was further impacted by on-boarding issues with a new pharmacy partner during the quarter.
- Net income margin was impacted by the same factor.
- Sales & marketing as a percent of sales rose from 3.3% to 5.8% YoY due to this grant and would have fallen to 3.0% of revenue without the impact (similar for G&A rising from 10.7% to 13.4% which would have been 8.0% without the grant).
- OCF margin compression was powered by a tweak to its pharmacy benefits manager contracts which benefitted its unit economics but lengthened payback periods which alters quarterly cash flow margins.
- This impact was not in place for Q1 2021.

c. Guide
2022:
- Progyny previously guided to $730-$775 million in 2022 sales. Progyny updated this to $735-$775 million for a midpoint of $755 million or a 0.3% raise. Analysts were looking for $751.3 million meaning this represents a 0.4% beat.
- Progyny reiterated its previous guidance of $110-$122 million in adjusted EBITDA for a $116 million midpoint. This beat analyst expectations of $113.5 million by 2.2%.
- Progyny reiterated its previous guidance of an incremental EBITDA margin over 19% -- pointing to continued margin expansion to come.
- Progyny also reiterated its net income guidance of $0.03 at the midpoint. Analysts were expecting $0.29 BUT Progyny’s guide does not assume any discreet income tax benefits which it expects to continue enjoying in 2022.
- Progyny also guided to 265+ clients and 4 million covered lives by July 2022. It is 1 client short and a few thousand members short as of today with “more clients (plural) to be on-boarded” from the 2021 selling season. It’s very much so on track. That still represents just 3% of its target market which doesn’t yet include schools, unions or other public employers.
Q2 2022 -- Progyny guided to the following:
- $188-$193 million in sales for 48% growth at the midpoint. Analysts were looking for $189 million meaning Progyny's guide represents a 0.7% midpoint beat.
- Earnings per share of $0.01 to $0.02 -- roughly in line with analyst expectations.
- $28 million-$30 million in adjusted EBITDA. Analysts were looking for $28.7 meaning Progyny's guide represents a 2.5% midpoint beat.
CFO Mark Livingston also told us that “Gross margin will expand sequentially.”
d. Notes from CEO Peter Anevski
On patient outcomes -- based on the latest fertility data from the CDC and SART, Progyny's:
- Pregnancy rate is now 17% better than the national average vs. 16% better last year.
- Live birth rate now 27% better than the national average vs. 25% better last year.
- Considering fertility treatment cycles cost $60,000 on average, more successful treatment is a massive employer/patient cost saver.
- 91% single embryo transfer rate (highest ever) vs. 90.1% YoY and multiple birth rate fell (good thing) from 2.8% to 2.5% YoY.
- Having twins is both less safe for the mother and far more expensive for all stakeholders. It also raises chronic care costs associated with lower-weight infants post-birth.
- National averages remain largely flat since 2015 while Progyny continues to improve.
“Other benefit managers don’t seem to be making improvements suggesting they either lack the focus or the ability.” — CEO Peter Anevski
On the selling season:
“Although we are in the earliest stages of our selling season, we are pleased with the level of sales closures and pipeline activity/size as well as the caliber of logos we are seeing thus far. Every measure we track is favorable to the record level of 2021 activity. We’ve had a healthy number of early commitments.” — CEO Peter Anevski
“The market for fertility benefits continues to mature as conversations with prospects are less and less about adding coverage and more about understanding the strength of our solution vs. others. This is giving us more opportunity to demonstrate how Progyny is differentiated with respect to member experience and outcomes.” — CEO Peter Anevski
Anevski told us that absolute customer and client adds will be larger in 2022 than in 2021. This implies minimum 2022 client growth of 32.2% and member growth of 30.8%.
e. Notes from CFO Mark Livingston
Quick notes:
- 83% of Progyny clients have ProgynyRx vs. 73% YoY. This is Progyny's fastest growing segment and continues to gain steam.
- The utilization dip via Omicron had resolved itself by quarter’s end.
- Treatment mix -- due to the frequent pauses and restarts -- skewed earlier on in treatment cycles. This means less Progyny revenue today but should mean shifting to higher revenue later in the year as treatment shifts to later-cycle.
f. My take
These were very solid results for Progyny. Modeling continues to be difficult for every company, yet it managed to deliver a small beat and raise. Incremental adjusted EBITDA margin over 19% points to much more margin expansion ahead and the successful selling season gears Progyny up for another year of explosive growth. This is an easy name to own, in my view.
2. Penn National Gaming (PENN) -- Earnings Review
a. Penn Demand
Analysts were looking for $1.53 billion in sales. Penn posted $1.56 billion, beating expectations by 2.0%.

More demand context:
- This YoY Penn Interactive growth excludes the positive impact of gaming tax reimbursements. YoY growth was 128% YoY when adjusting for this.
- Note that Penn had a solid 2021 where it grew revenue by 17% vs. the most recent pre-pandemic period. This YoY growth involves somewhat normal comps and also doesn’t benefit from the stimulus tailwind Penn enjoyed last year.
- Penn's 21-34 year-old consumer cohort is up 83% since pre-pandemic as it has successfully evolved its demographic to younger consumers with longer spend runways.
b. Penn Profitability
Analysts were looking for:
- $466.3 million in adjusted EBITDA. Penn Posted $434.6 million, missing expectations by 6.8%.
- $0.45 in earnings per share. Penn posted $0.29, missing expectations by $0.16.
YoY net income was hit by $61 million in incremental “other expenses” along with another incremental $50 million in interest and taxation charges.

c. Guidance
2022 guidance:
- Penn previously guided for $6.07-$6.39 billion in 2022 sales or a midpoint of $6.23 billion. This quarter, it raised that revenue outlook by 2.7% to $6.15-$6.55 billion or a midpoint of $6.35 billion. This came in ahead of analyst expectations of $6.3 billion by 1.6%.
- Penn also previously guided to $1.85-$1.95 billion in adjusted EBITDAR for a midpoint of $1.90 billion. Now, it expects $1.88-$2.0 billion for a midpoint of $1.94 billion, representing a 2.1% raise.
“Q1 demand trends are continuing to date into Q2.” — CEO Jay Snowden
A strong outlook in this macroeconomic environment is notably impressive to me.
d. Investor Materials & Call Notes
On the mychoice loyalty program:
- Penn added 355,000 net new customers to mychoice during the quarter. This was 17% above its net new adds last quarter and 33% ahead of its net new adds YoY.
- “mywallet” -- its cashless, card-less and contactless payments system -- has shown to raise visit frequency by 18% and time on device by 22%. It has 53,000 downloads.
On theScore Bet’s Ontario Debut:
- Penn offered the following data on theScore Sportsbook’s launch in Ontario, Canada on April 4th:
- Top downloaded app since launch.
- 79% of gamblers use theScore Media in Ontario.
- The debut enjoyed 37% more registrations and 28% more DAUs vs. the launches in Michigan and Pennsylvania due to first mover advantage.
- Score’s Player Account Management (PAM) system allows for:
- theScore Media integration (so you can place bets within Score Media if you have a Score Bet account).
- Enhanced conversion due to full ownership of the on-boarding process.
- Granular, contextualized promotions to raise activity and ROI with minimal, targeted marketing dollars. Barstool will eventually integrate this software.
“Ontario is off to a great start. I had high expectations and we’re doing better than I thought we’d do… Since launch, everyday thereafter we continue to see significant -- thousands -- of incremental daily downloads. And the churn has been low.” — CEO Jay Snowden
On Penn Interactive:
- theScore grew sales 42% YoY with 1.6 billion user sessions and continues to "garner high levels of engagement."
- Barstool will broadcast the Canelo vs. Bivol boxing match as an alternative stream and a further extension into live sports.
On the Balance sheet:
- Penn bought back $175 million of its stock with $575 million remaining in the program.
- $2.48 billion in total liquidity.
- $923.5 million in net debt (rose sequentially due to using cash to buy back more shares).
- Lease-adjusted net leverage 4.04X vs. 4.10X YoY.
- Entered into a new $1 billion credit revolver (fully undrawn vs. previous revolver of $700 million), a 5-year $550 million team loan A and a 7-year $1 billion term loan B. These were used to pay off existing term loans. This was “leverage neutral.”
- 85% of its debt is fixed rate with the earliest maturity in 2026.
On Penn Interactive:
- “Integrated media and retail operations have led to an “industry-low customer acquisition cost (CAC).”
- Barstool Sportsbook and iCasino is tied for 1st in sports betting apps with a 4.8* rating.
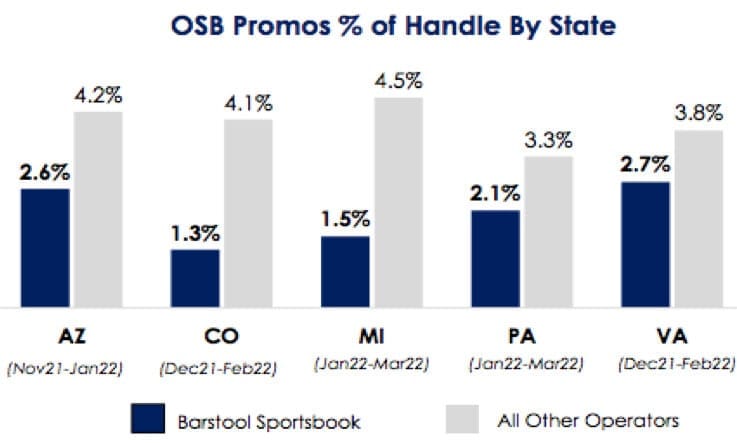
- Since debuting in Louisiana, Barstool has gained 7.9% handle share but 12.4% gross gaming revenue (GGR) share and 10.6% net gaming revenue (NGR) share to show its relatively minimal promotional spend vs. competitors.
- Handle counts promotional dollars while NGR does not. This is why Barstool's NGR share is so far ahead of its handle share -- it doesn't need to pay gamblers nearly as much in promotions to convince them to use the service.
- Barstool iCasino GGR was $32.8 million for the quarter vs. $31.7 million QoQ and $15.5 million YoY.
- Since launching an iCasino channel on Twitch, Barstool's "Coin Boys" is now in the top 1% of all of its programming.
On omni-channel market share gains:
- Penn has YTD 18.6% of total U.S. Retail Sportsbook market share ex-Nevada. Penn reported this at 12.0% just one quarter ago!
- Penn’s NGR share across Pennsylvania, Michigan and Arizona was 10.7% this quarter vs. 8.4% last quarter.
- Its Vegas property (M resort) now doing quadrupole the EBITDA it was a few years ago.
“Our interactive business continue to demonstrate how disciplined marketing, omni-channel cross selling, great products and owning our media strategy via Barstool and Score led to NGR market share growth in Q1 2022. We don’t lead with discounts and these structural advantages are proving themselves in best in class margins over the long term.” — CEO Jay Snowden
More interesting call notes from the team:
- It thinks 37% EBITDA margins are sustainable for its properties.
- Penn was “quite active in the quarter” with buybacks. It saw its stock at $46 as significantly undervalued and told us to assume it would continue to be “active.”
- Penn is not seeing any drop off from its lower income cohort like some of its competition blamed on their own underwhelming results.
e. My Take
This was a largely positive quarter for the company. I didn’t love the profit miss, but the raised profit outlook for 2022 and the strong demand made that far more palatable to me. Barstool and Score are showing concrete signs of allowing Penn to grow its interactive segment with relatively little spend -- I continue to believe that will be a massively profitable growth level for it to pull in the years to come. Score is the most popular sports brand in Canada, Barstool is an American cult and Penn has both of them at its disposal to effectively, profitably compete.
Time in the Market Beats Timing the Market

Around 90% of day traders underperform the market, supporting Warren Buffett’s idea that time in the market is better than timing the market.
The best way to maximize your time “in” the market is through regularly scheduled investments.
Did you know that FTX US lets you schedule regular buys directly from your bank account, whenever you want?
Daily, weekly, bi-weekly, monthly, you pick the cadence for your portfolio. The best part? FTX US just announced stocks are coming soon.
There are no fixed minimum fees on transactions, and no ACH transaction fees whatsoever.
3. Match Group (MTCH) -- Earnings Review
Shar Dubey will step down as CEO after 16 years with the firm. She will stay on as a member of the Board of Directors. The company replaced Dubey with Bernard Kim, the President of Zynga.
a. Match Demand
Match Group guided to a midpoint of $795 million in quarterly revenue with analysts expecting the same. A strong dollar led to $26 million in added FX headwinds -- it slightly beat expectations regardless.

More demand context:
- RPP growth in Europe and APAC each suffered from a 7% FX headwind.
- As depicted below, the pandemic did not have a tangibly positive impact on Match Group’s business like some seem to think. Yes, it did raise overall screen time, but it also greatly lowered propensity to spend on meeting that special someone in person.
- It was a clear net negative and a fading away of Covid-19 would absolutely accelerate Match’s operations.
- Match Group’s acquisition of Hyperconnect inorganically propped up 2021 growth rates by mid-single digit percentages.

b. Match Profitability
Match Group guided to $262.5 million in adjusted operating income (AKA adjusted EBITDA) with analysts expecting the same. Match posted $273 million, beating expectations by 4.0%.
Analysts were looking for $0.48 in earnings per share. Match posted $0.60, beating expectations by $0.12. This shrank YoY from $0.66 in EPS in Q1 2021 largely due to non-recurring legal charges that Match is working through.
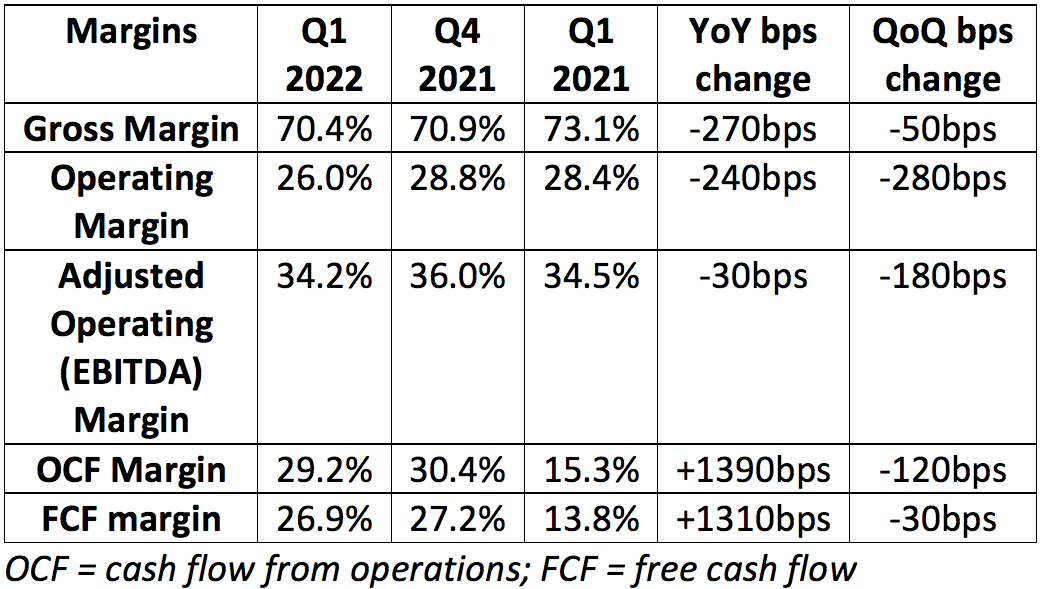
More margin context:
- Cash flow margins got a YoY boost from a net benefit of $6.1 million in quarterly accounts receivable vs. a net negative of $75 million YoY.
- With the same benefit last year, OCF margin would have been 27.4% and that margin line would have only expanded by 180 bps YoY.
- Similarly, FCF margin would have been 25.9% and expanded by 100 bps YoY.
- This is still a strong cash flow result, but it did get a boost from this line item which should be called out as it will be volatile on a quarterly basis.
- Gross margin compression via Hyperconnect acquisition. The margin would’ve been 73.8% without it.
- R&D was 10% of sales vs. 8% YoY as it re-allocated marketing dollars into R&D. This is the result of accelerating headcount growth at Tinder and Hinge.
- Sales & marketing was 19% of sales vs. 22% YoY as it awaits macro trends improving to lean back into spend. CFO Gary Swidler referred to the marketing environment they play in as “frothy” during the call, which is forcing some caution with advertising.
“Match continued to be very disciplined with marketing spend given the pace of the recovery while continuing to invest in product and development for the long term. We’ve remained nimble on expenses throughout the portfolio, keeping dry powder for when macro conditions improve.” — Match Group Shareholder letter

c. Guidance
2022:
- Match updated its previous 15-20% 2022 revenue growth guide to be “closer to the low end."
- This includes a 4% FX growth headwind (largely incremental vs. the last quarterly guide) and a 1% war in Ukraine impact.
- Match Group’s Gary Swidler reiterated the expectation to expand adjusted operating income margin by 50-100 basis points YoY and added Match “may even do a bit better than that with some spend discipline.”
- Based on its 2021 margin performance of 35.8%, this implies a margin of 36.3%-36.8% for 2022.
- This improvement includes a 2.0% margin hit from Hyperconnect AND a 1.5% anticipated margin hit from Google forcing usage of its payments service.
- This guidance assumes we get back to pre-Omicron levels but not pre-pandemic levels.
Q2 2022:
- Match Group guided to $800-$810 million in Q2 2022 sales for 13-14% growth. This missed analyst expectations of $835.7 million at the midpoint by 3.7%.
- This includes a 5% revenue growth headwind (was expected to be in the 3% range) related to FX headwinds and another 1% impact via the war in Ukraine. The guide would have been $845 million on an FX neutral basis.
- For some added context, 6 months ago Match was enjoying a neutral YoY FX exchange impact. Last quarter, currency exchange was a 2% hit to growth and this quarter that impact doubled to 4% with it expected to worsen before improving.
- It also guided to $285-$290 million in adjusted operating income. This missed analyst expectations of $300.6 million by 4.4%.
- CFO Gary Swidler added the following details:
- It expects double digit YoY payer growth.
- It expect single digit YoY RPP growth despite FX headwinds but 200,000 less payers QoQ due to removing age-based discounts on Tinder (no revenue impact).
d. Shareholder letter notes:
On the balance sheet:
- $921 million in cash & equivalents + short-term investments.
- $4 billion in long term debt.
- Its $750 credit revolver remains fully untapped.
- The Board authorized a 12.5 million share buy-back program.
On Tinder:
- Tinder payer growth was slightly aided by a “slower than expected roll-out of an initiative to eliminate age-based discounts.” This will impact Tinder Payer growth more in the second quarter this year.
- Tinder’s new background-check service called Garbo debuted to an “overwhelmingly positive response” during Q1 2022. This will roll-out to the rest of its brands throughout the year.”
On the product roadmap:
- Match launched festival mode in tandem with Live Nation “ to enable members to connect before or during 20 of the biggest global festivals.”
- Tinder Coins -- really its take on a loyalty program in my view -- is on track to launch this summer.
- The virtual goods trading ecosystem it has planned will be powered by this coin. It will begin beta-testing it later this year.
- Tinder is testing monetization packages catering to its female users.
- This apps revenue skews more male than Match’s other apps and this is one of its initiatives to address that.
- Hinge will launch in Germany in Q2 with a planned marketing campaign.
- It will launch in a few more markets in 2022 including India where “strong organic traction pre-any localization efforts” is prompting the company to move up its launch plans.
- On track with its video/audio chatting/streaming integrations across its product portfolio using Hyperconnect’s technology.
On the Google Play App Store and Regulation:
- The EU’s Digital Markets Act was signed into law to “prevent tech giants from abusing their market position and to outlaw mandatory in-app payments (IAP) and other anti-competitive practices.”
- There have been similar rulings is S. Korea, Netherlands, France, India with many close to joining them.
- “It is now widely expected that the U.S. Congress will take up App Store legislation by the summer.”
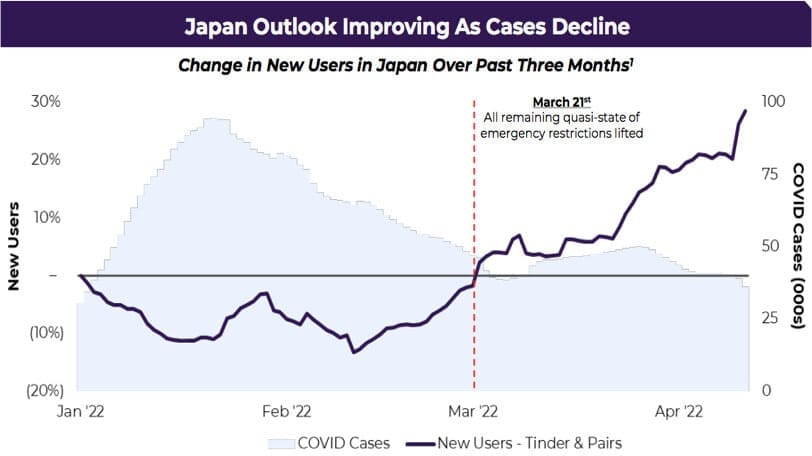
On a Japanese Case Study:
Japan is Match Group’s 2nd largest market. The firm has seen stabilizing operating and financial performance since pandemic restrictions in Japan were lifted in mid-March.” Strong user and traffic growth prompted both Tinder and Pairs (its 2 popular apps there) to launch new marketing campaigns. It shared a fascinating chart on the wildly strong inverse correlation between new app downloads and Covid cases: