
In case you missed it:
- Alphabet & Tesla Earnings Reviews.
- Chipotle Earnings Review.
- ServiceNow Earnings Review.
- Netflix & Taiwan Semi Earnings Reviews (from two weeks ago)
- Portfolio Earnings Season Preview.
- Updated Holdings & Performance as of Today.
Table of Contents
- 1. Starbucks (SBUX) — Brief Earnings Snapshot
- 2. SoFi (SOFI) – Detailed Earnings Review
- 3. PayPal (PYPL) — Detailed Earnings Review
1. Starbucks (SBUX) — Brief Earnings Snapshot
a. Demand
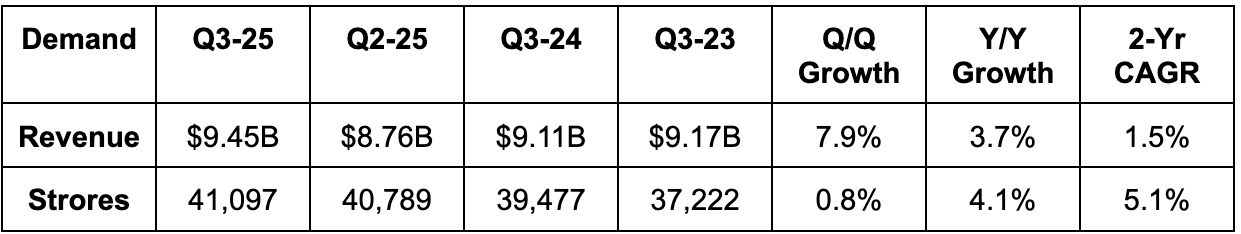
- Beat revenue estimates by 1.8%
- North America revenue beat estimates by 1%.
- International revenue beat estimates by 0.6%.
- Channel development revenue beat estimates by 12%.
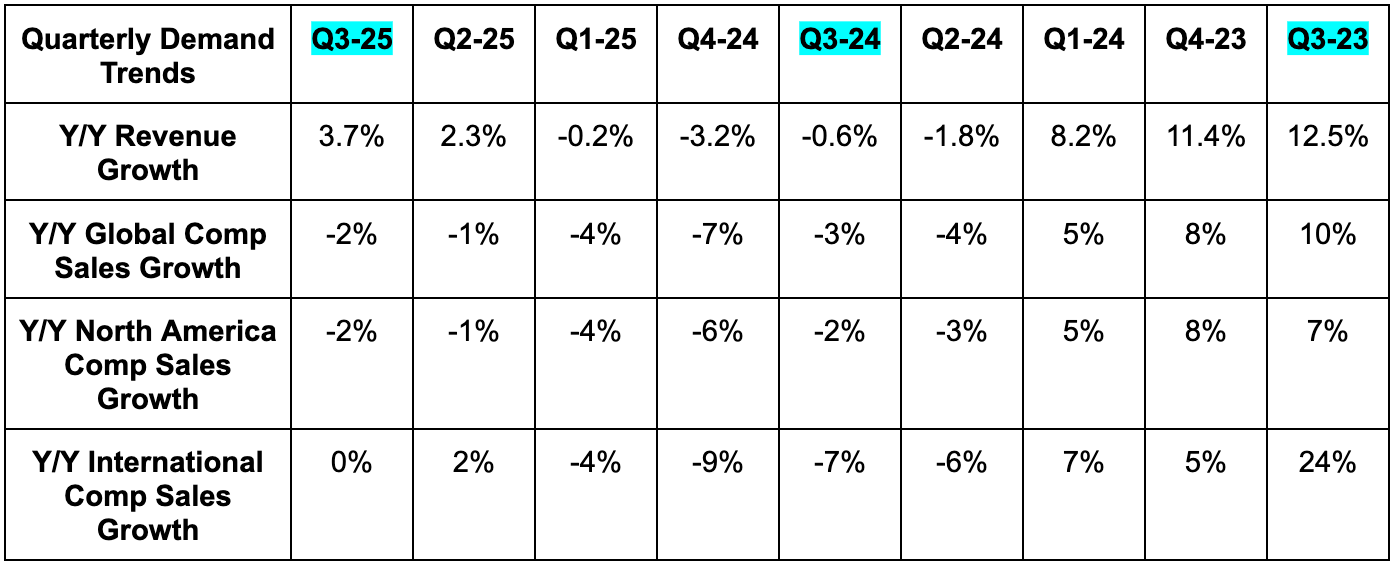
- Comp store sales fell by 2% vs. a 1% decline expected.
- U.S. comp store sales were -2% vs. -3% expected.
- International comp store sales were 0% vs. -2% expected.
- China comp store sales were 2% vs. 1% expected.
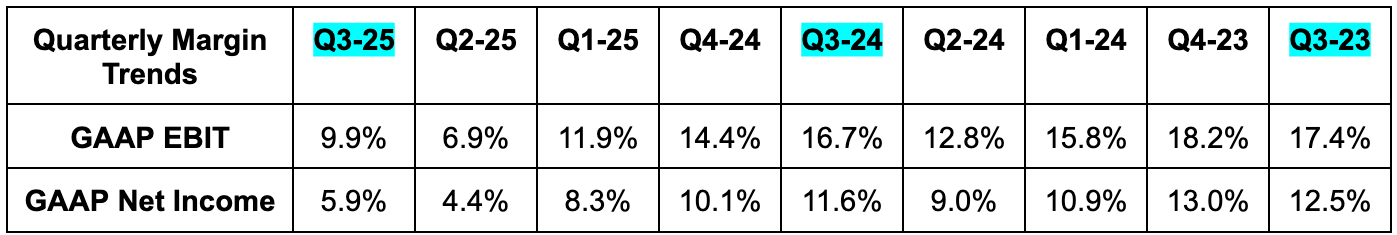
b. Profits & Margins
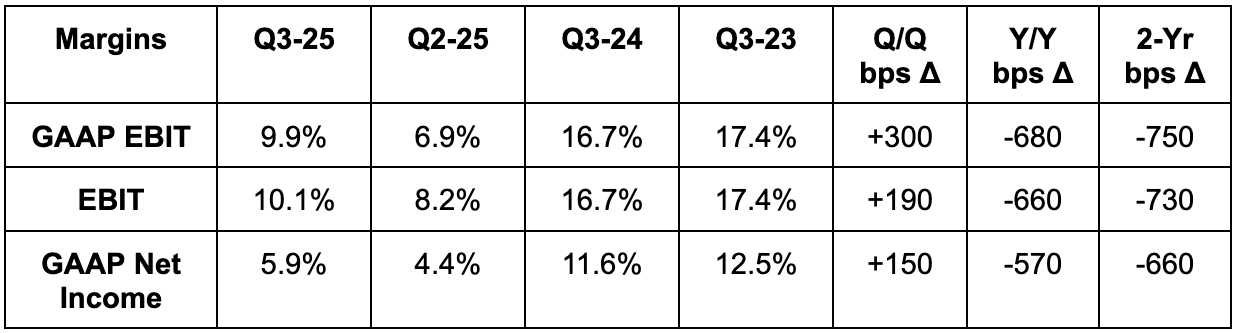
- EBIT missed by 11%
- North American EBIT missed by 17%.
- International EBIT missed by 9%.
- Channel Development beat by 1.8%.
- EPS missed $0.65 estimates by $0.15.
c. Balance Sheet
- $4.5B in cash & equivalents.
- $2.26B in inventory vs. $1.85B Y/Y.
- $17.3B in total debt.
- Diluted share count rose by 0.3% Y/Y.
- Dividends rose 7% Y/Y.
d. (No) Guidance & Valuation
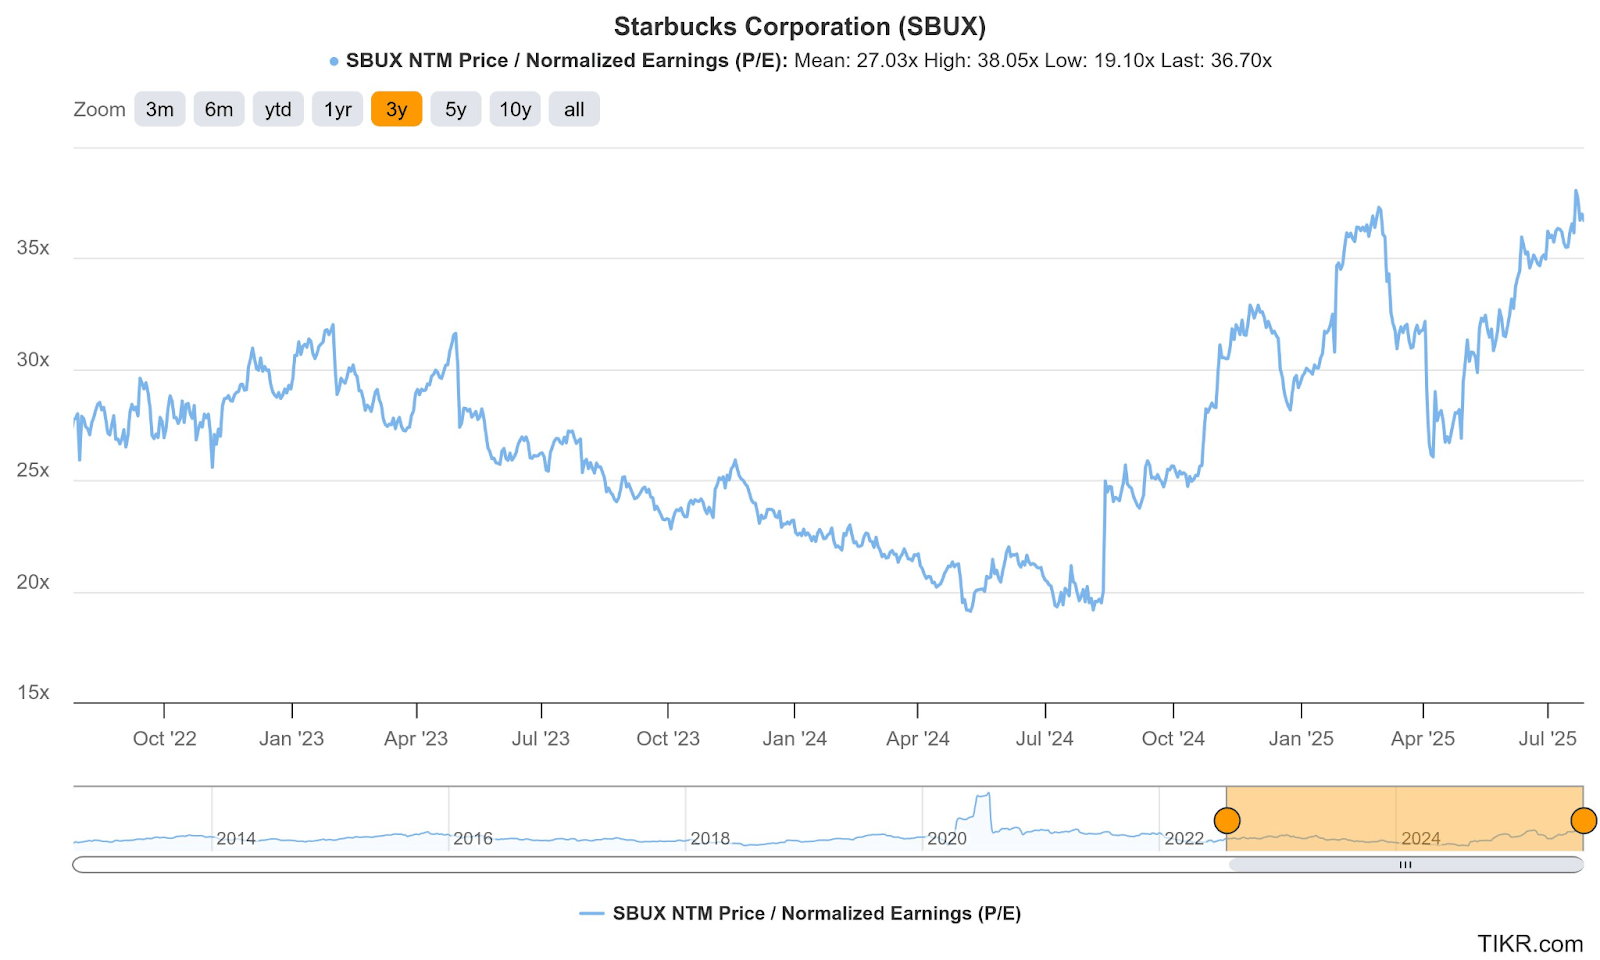
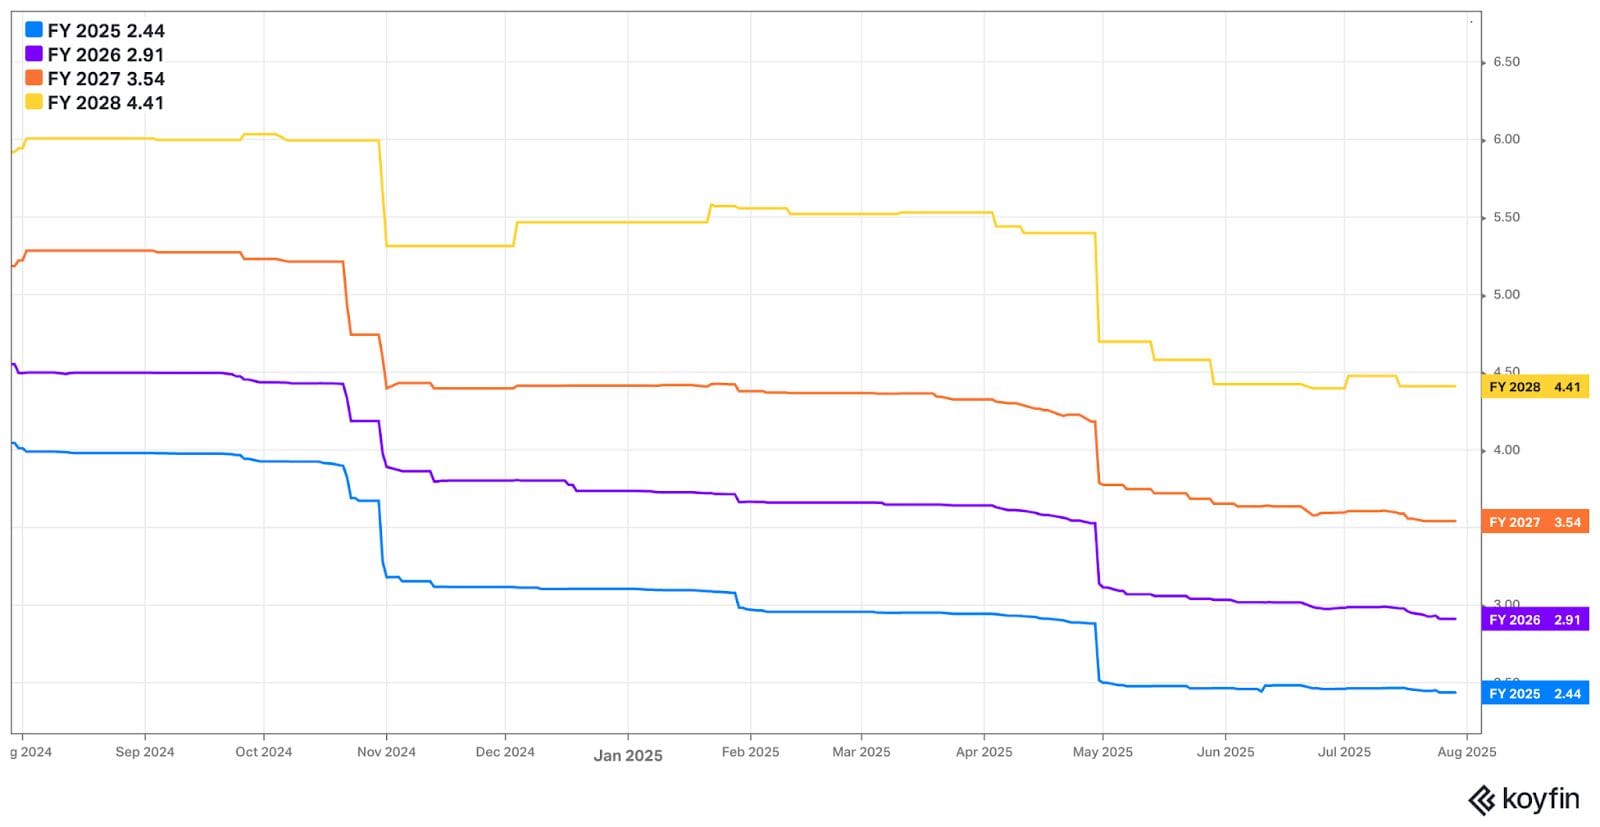
Still no guidance. SBUX trades for 36x forward EPS (the Brian Niccol effect). EPS is expected to fall by 27% this year, and then compound at a 20% clip over the next two years.
2. SoFi (SOFI) – Detailed Earnings Review
SoFi is a one-stop shop for financial services. It aims to provide consumers with excellent products for all major needs and events. It further pushes to delight them to the point of never going anywhere else. That creates key cross-selling and acquisition cost benefits. It has a large lending business with an increasingly diverse array of funding options, as well as bank accounts, brokerage services, 3rd-party insurance options, credit cards and so much more. It also owns its tech stack, has no branches and possesses a bank charter, which all give it the rare ability to combine the cost edges that incumbents and fintechs each enjoy. It also sells its tech stack to customers like H&R Block and Robinhood. My SoFi deep dive can be found here. This gets into intricate detail on SoFi’s unique value proposition within banking, and everything else you need to know about the firm.
a. Key Points
- Accelerating, margin accretive growth.
- Strong credit performance.
- The lending platform is thriving.
- Outperforming membership growth.
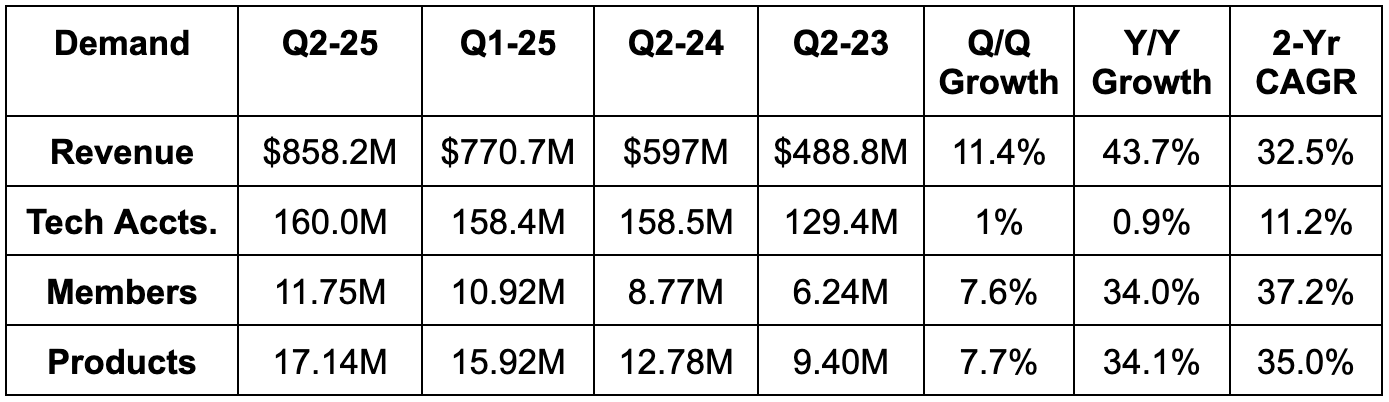
b. Demand
- Beat revenue estimates by 6.6% & beat guidance by 7%.
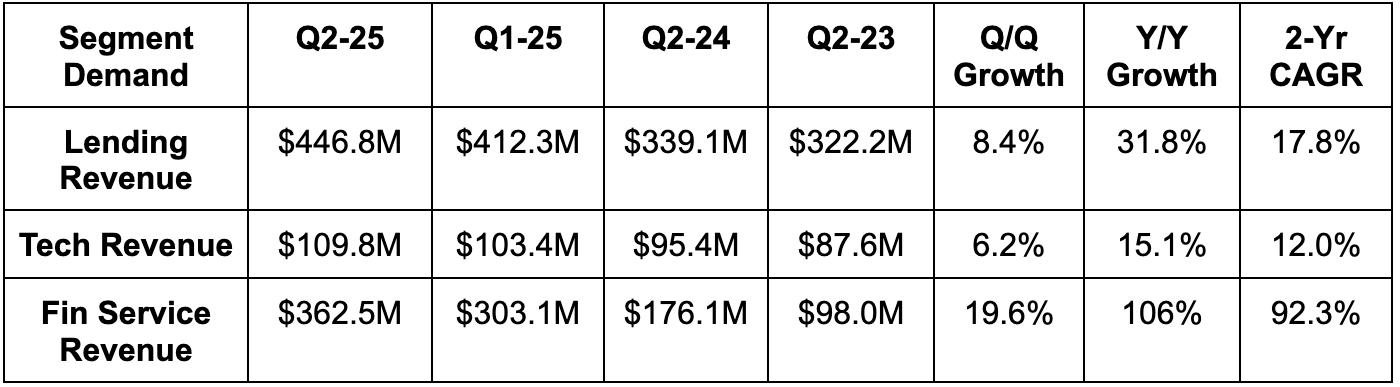
- Tech revenue beat estimates by 4.5%.
- Lending revenue beat estimates by 4.6%.
- Financial services revenue beat estimates by 20%.
- Net interest income beat revenue estimates by 2%.
- Non-interest income beat estimates by 20%. This is where all of the asset-light fee revenue that’s not tied to balance sheet growth is.
- Beat membership estimates by 1.1%.
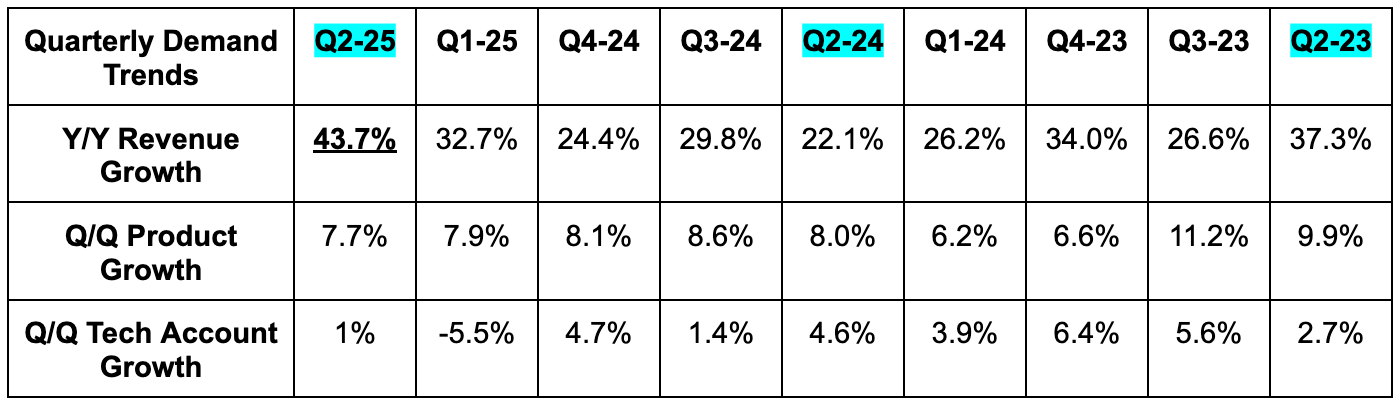
- It was great to again see product growth in excess of member growth (even if just by a little bit) on a Q/Q and Y/Y basis.
- This was SoFi’s fastest rate of revenue growth in over two years. The 11-point Q/Q growth acceleration was far in excess of the 4 points of help from easier comps.
- SoFi’s unaided brand awareness has now reached 8.5%. Clearly, the CMA Fest sponsorship went well, as SoFi was around 7% just last quarter. 1.5 points in a 90-day period is quite significant and will simply make their customer acquisition more efficient, thus unlocking more productive marketing spend.
c. Profits & Margins
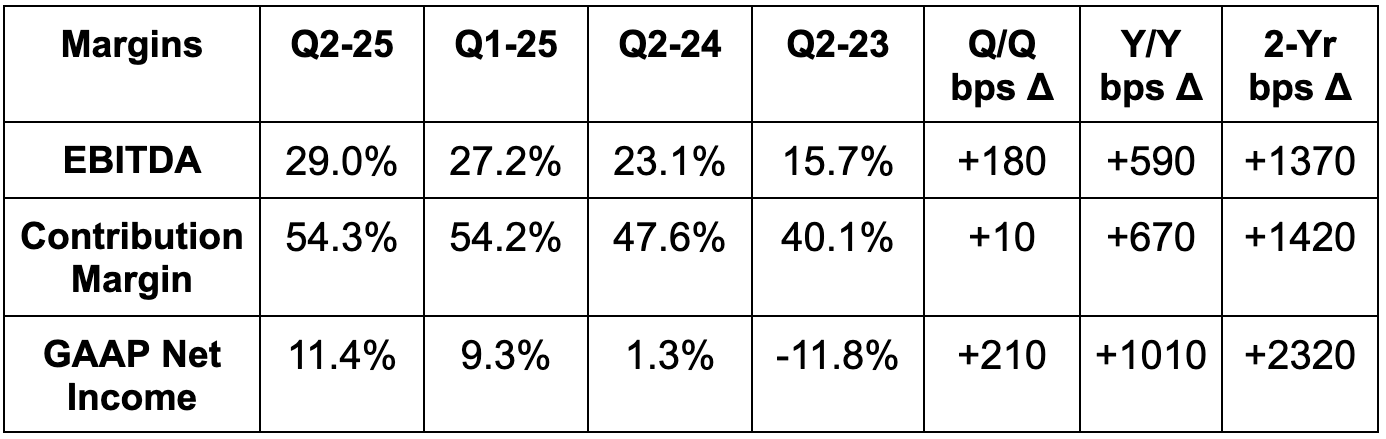
- Beat EBITDA estimates by 19.7% & beat guidance by 21%.
- 43% incremental EBITDA margin vs. its annual guidance calling for a 27% incremental margin.
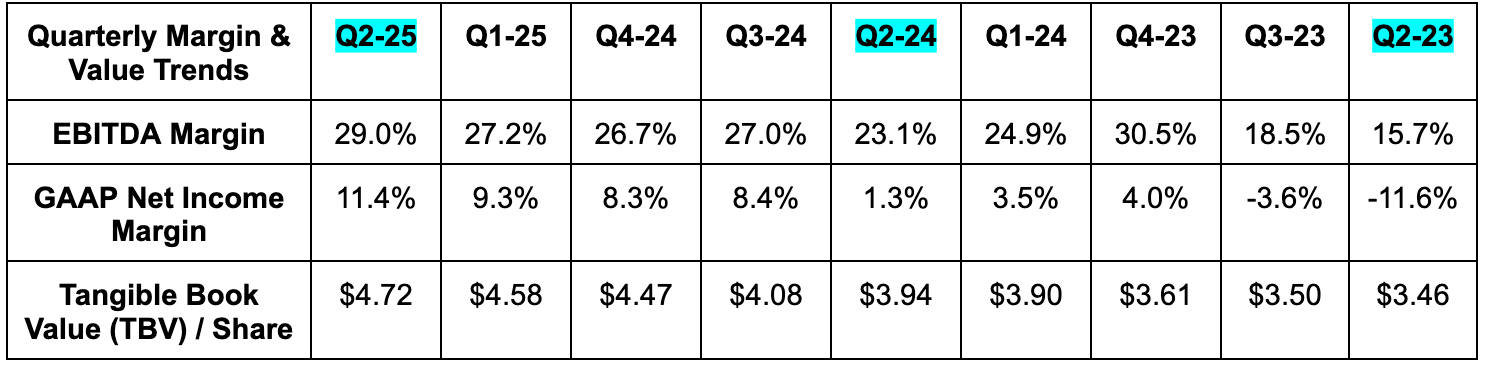
- Beat $0.06 GAAP EPS estimates by $0.02 & beat guidance by $0.025. $0.01 of the beat was driven by tax favorability.
- EPS rose from $0.01 to $0.08 Y/Y.
- Beat $4.56 tangible book value per share (TBV/share) estimates by $0.16 or 3.5%.
- Missed 5.91% net interest margin (NIM) estimates by 5 basis points (bps; 1 basis point = 0.01%).
- NIM was 5.86% vs. 5.83% Y/Y.
- NIM was aided by a 77 bps reduction in cost of funds, which was offset by 56 bps via lower asset yields. This is Y/Y data, so it does include 3 rate cuts. Good to see NIM still rise Y/Y. It shows you they can lower deposit yields faster than benchmark rates fall while maintaining great deposit growth.
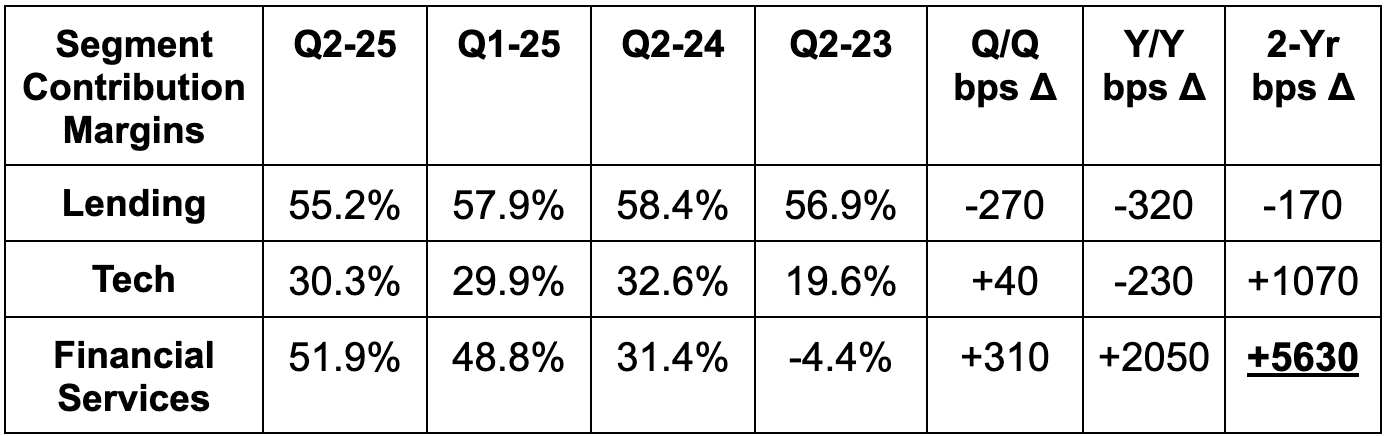
- By segment:
- Financial services contribution margin beat 46% estimates by nearly 6 points.
- Tech platform contribution margin roughly met estimates.
- Lending contribution margin missed estimates by 330 bps.
d. Credit & Capital Market Health
Accounting Refresher:
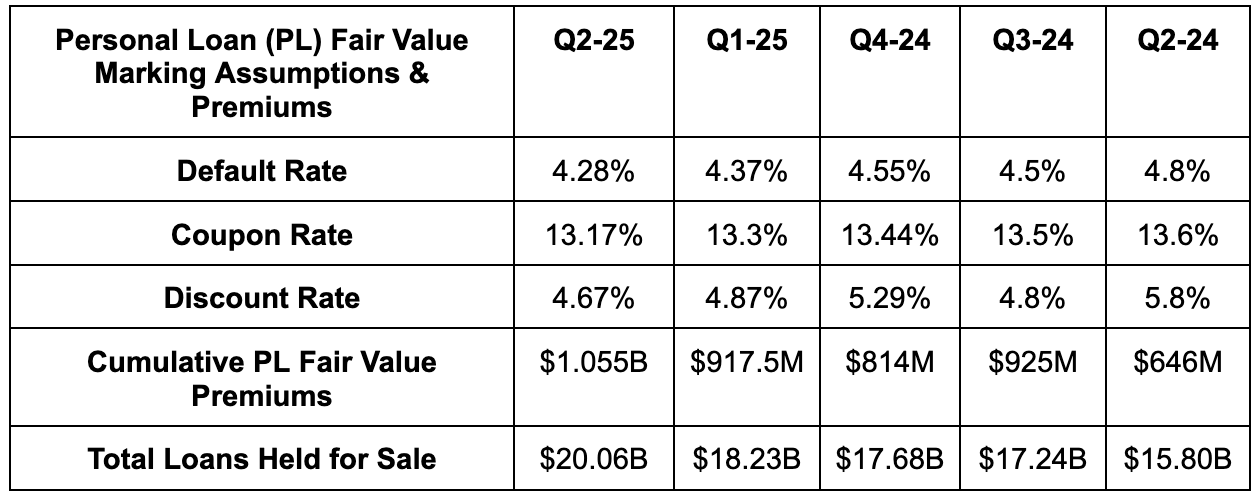
As we work through this section, recall that net charge-off (NCO) is a lagging credit indicator, while delinquency rates are more of a leading indicator. Also note that SoFi doesn’t practice current expected credit loss (CECL) accounting like most of its competition. Instead, based on its desire to frequently sell loans into capital markets, it uses fair value accounting. This deploys an independent 3rd-party auditor, highly conservative macro assumptions and overly harsh delinquent loan write-down standards to set fair value markings on loan pools. To avoid pent-up unrealized losses (what caused the regional banking crisis), markings and changes in fair value flow through the income statement every single quarter. It hedges away all of these changes to eliminate the conflict of interest of shadily propping up fair values.
Credit Health:
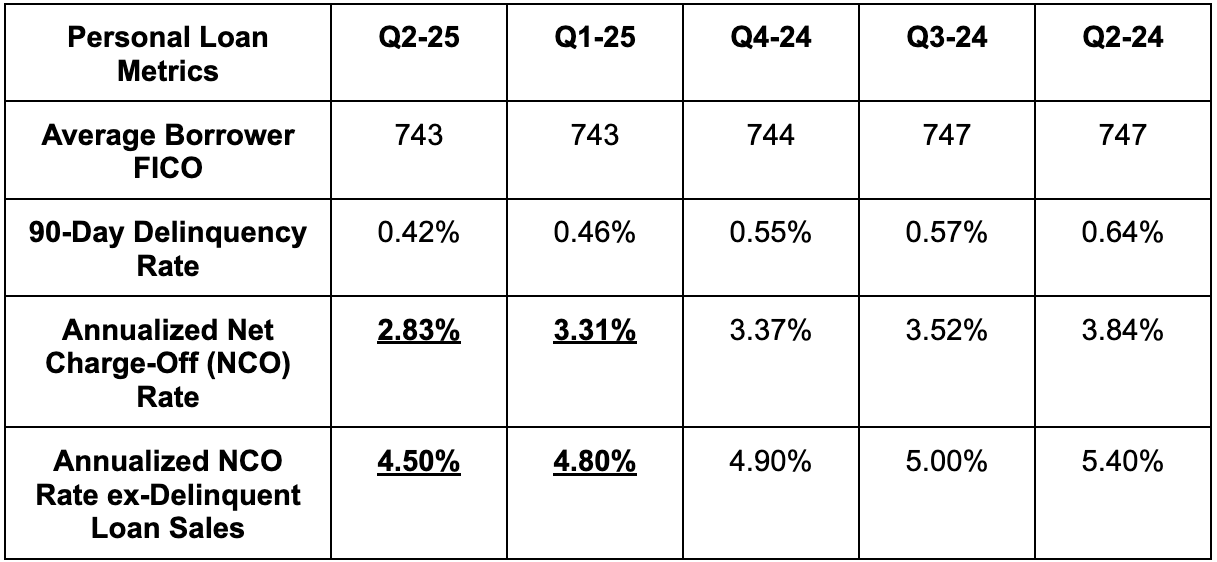
As you can see below, even when excluding $90M in late-stage delinquent personal loan (PL) sales (a routine part of banking operations), PL NCO rate continued to materially improve Q/Q. That’s happening while the PL 90-day delinquency data also continues to improve.
SoFi remains confident in their life of loan loss rate ceiling remaining at 7%-8% and offered more compelling vintage-level data to support this stance. For Q4 2022 through Q3 2024 vintages, net cumulative losses are 4.23% while 59% of the total principal has already been paid. The last time the company approached 7%-8% loss rates, cumulative losses were 5.75% at this point of repayment. Not only are they comfortably below 5.75%, but the gap between present performance and 2017 performance continues to positively widen. It grew by 19 bps Q/Q, following 16 bps of improvement the quarter before that. For vintages ranging from Q1 2020 - Q1 2025, its 6.7% cumulative loss rate means the remaining credit would need to deliver a 10% cumulative loss rate to breach its loss tolerance. It has never come remotely close to that, as the hyper-responsible creditor remains highly selective in the borrowers it’s approving and focused on constant underwriting improvements.
This continued proof of underwriting quality will support SoFi’s own origination growth ceiling, continued capital market loan buyer health and its quickly expanding margin profile. More really good news in this department.
For student loans, there are a few notes to discuss. SoFi swapped servicers, which meant some losses were pushed from Q1 to Q2. They also bought a student loan portfolio with higher charge-offs than their overall portfolio. This led to its annualized NCO rate spiking from 47 bps to 94 bps. When excluding these two things, NCO was 64 bps in Q1 and 68 bps in Q2. They “expect normalized levels going forward. Finally, student loan default rate assumption and 90-day delinquency rates were both stable Q/Q at 0.67% and 0.13%, respectively.
- Their average personal loan borrower earns $161K per year with a 743 FICO.
- Their average student loan borrower earns $136K per year with a 768 FICO.
Capital Market Activity:
Quick reminder on the lending segment and the loan platform business (LPB) to tee up this segment. The company has a traditional lending business, SoFi Lantern and LPB. Traditional lending revenue comes from originating loans for its own balance sheet and either holding them or selling them to capital market buyers. That’s lending revenue. When borrowers are rejected, SoFi can send applicants to its loan marketplace, called Lantern, to match them with other creditors in exchange for a referral fee. It says no to many more borrowers than it says yes to. Lantern is a great way to keep them in the overall SoFi ecosystem, collect more revenue and enjoy more cross-selling opportunity. Lantern is financial services revenue. LPB is where it signs forward flow agreements with partners like Fortress Capital to originate loans on their behalf – right from SoFi’s app or site. Here, the vast majority of revenue is within financial services, with a very small servicing sliver counted as lending revenue. So far, LPB has been for borrowers within its credit band and, again, a way to raise its origination capacity without growing the balance sheet. That’s so important.
Now, back to the quarter.