a. Demand
The company guided to the following:
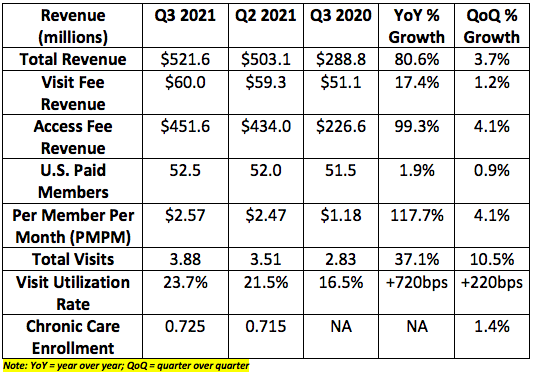
- $510-$520 million in sales for the quarter. The company generated $521.6 million in sales beating expectations by roughly 1.3% at the midpoint.
- 52-53 million U.S. paid members. It posted in line results.
- Total visits between 3.4-3.6 million. It posted 3.88 million beating expectations by 10.8% at the midpoint.

Total revenue growth was largely driven by U.S. access fee growth of 113% year over year. International access fee growth was 19% and is a much small piece of the business.
As a note, this quarter is a seasonally weak period for chronic care enrollment (Livongo). This result came in as expected.
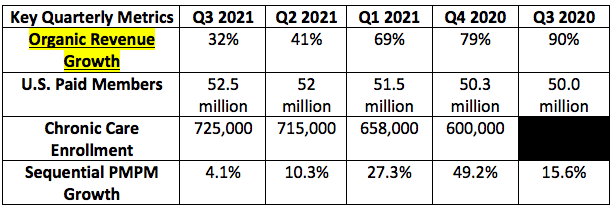
The first 2 metrics in the quarterly chart below depict the strength of demand for Teladoc’s core legacy business. The following 2 metrics in the quarterly chart below depict the traction for Livongo’s products that Teladoc is enjoying.

b. Profitability

C. Balance Sheet
Highlights:
- $826 million in cash & equivalents = ~2.5 years of cash burn at the current (temporary) quarterly net loss rate.
- $1.21 billion in convertible and long term debt.
- $111 million in year to date operating cash flow.
d. Guidance
Expectations for Q4 2021 guidance were as follows:
