
The Trade Desk is the de facto demand side platform for open internet programmatic advertising. It morphs ad campaigns from guesswork to precisely valuing impressions one by one, and in real time. If you’d like to learn more, my deep dive can be found here. The financial data is now dated (with quarterly earnings reviews and frequent news coverage since then for updates). The rest is not.
I’ll also reference “Kokai” throughout this article. That refers to The Trade Desk’s newly upgraded bidding platform. A detailed explanation of the launch and the various products within it can be found here.
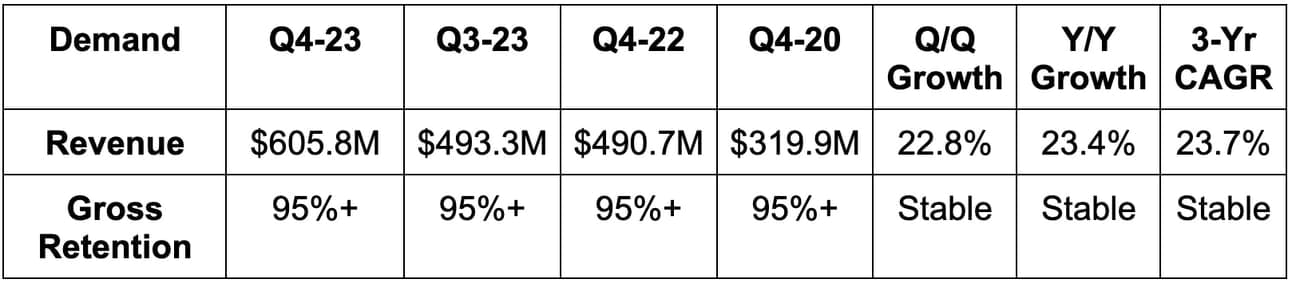
1. Demand
- Beat revenue estimates by 4.1% & beat guidance by about 4.4%.
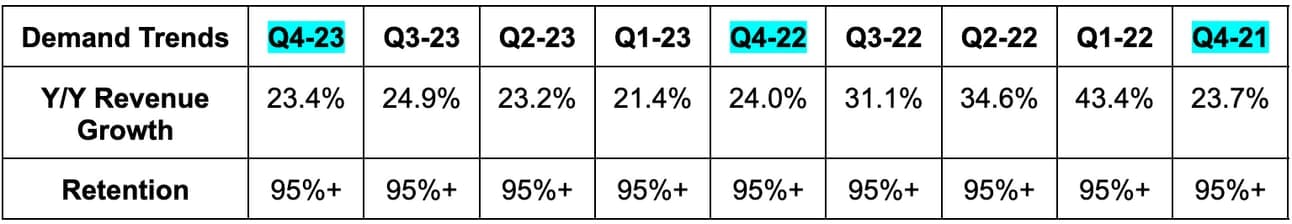
- Growth was 27% Y/Y ex-political spend.
- Take rate remained stable in 2023 for the 7th straight year since going public.
- The 23.7% 3-year revenue compounded annual growth rate (CAGR) compares to 31.7% as of last quarter and 49.3% 2 quarters ago.
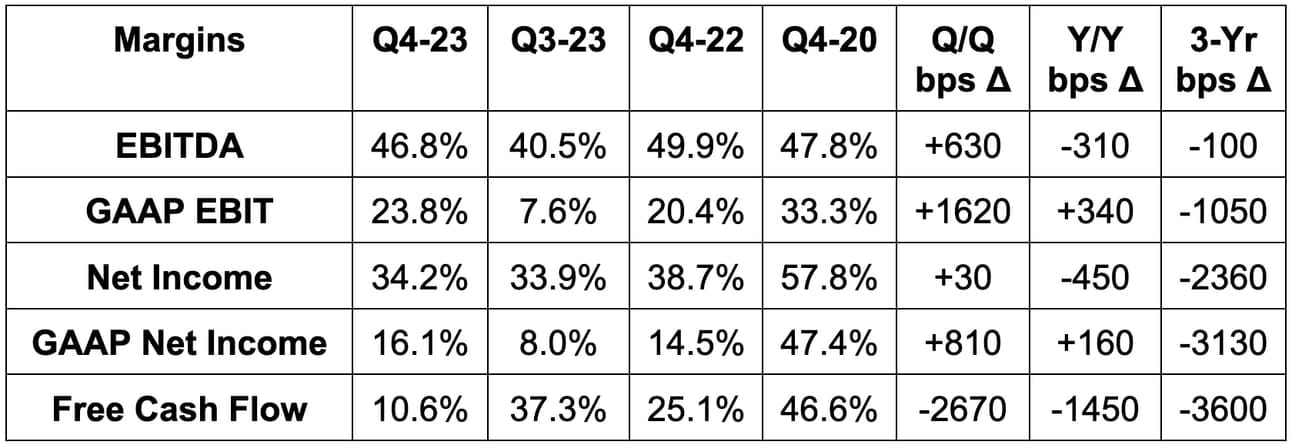
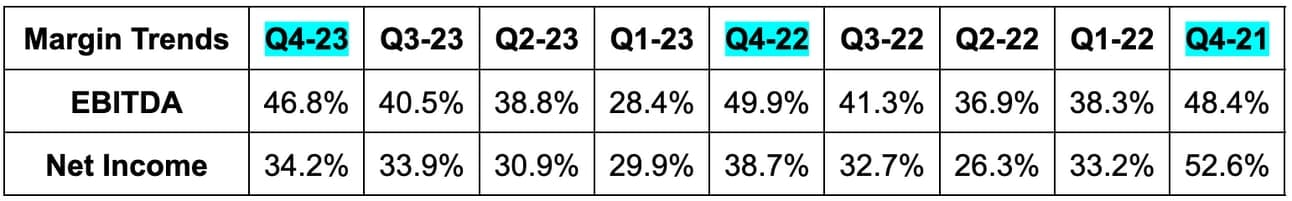
2. Profitability
A few items to note on margins. First, a large Q4 2020 tax benefit propped up net income and free cash flow (FCF). This makes for a difficult 3-year margin comp this quarter. Furthermore, Jeff Green’s founder awards continue to vest, which is hurting its GAAP margins. This will be the case through Q3 2025. Money well spent on this superstar, in my shareholder opinion.
- Beat EBITDA estimates by 3.6% & beat guidance by 5.2%.
- Beat GAAP EBIT estimates by 20%.
- Met $0.19 GAAP EPS estimates.
- Missed $0.43 EPS estimates by $0.02.
The combination of adjusted EBITDA and GAAP EBIT beats paired with the adjusted EPS miss tells me the “miss” was related to sell-side mis-modeling effective tax rate. To offer support for this, its tax bill rose 55% Y/Y to greatly lead revenue and profit growth. It doesn’t guide to tax rate expectations.
3. Pretty Balance Sheet
- $1.4 billion in cash & equivalents.
- No debt.
- Share count fell slightly Y/Y due to $220 million in buybacks. It added another $700 million in buyback capacity this quarter. It has $753 million in total capacity (just about 2% of the market cap).
4. Guidance & Valuation
The Trade Desk beat Q1 revenue estimates by at least 5.7%. The guidance implies 23.5%+ Y/Y revenue growth for a Q/Q acceleration. It also beat EBITDA estimates by 14.6%. It plans to grow headcount more slowly than revenue in 2024.