
Table of Contents
- a. Introduction & Key Points
- b. Demand
- c. Profits & Margins
- d. Balance Sheet
- e. Guidance & Valuation
- f. Call & Release
- g. Take
Quick Housekeeping:
Microsoft came out saying the report on data center loan cancellations from TD Cowen was incorrect. TD Cowen also came out with a follow-up note saying they expect overall GenAI infrastructure growth to remain quite strong.
The Block review is in the works. I am extremely busy in terms of keeping up with these reports. It’s coming eventually and I appreciate your patience. As far as I can tell, the report really was not that bad (regardless of price action). A lot of mumblings following the call center on disbelief in the company meeting 2025 targets. I have more to read, but that’s my early takeaway. If you’re confident in them hitting those targets, there’s probably a lot to like here. If you’re not, estimate revisions will remain negative and this company could continue to struggle. I go back and forth and place this firmly in my “too hard pile.” Much more coming.
a. Introduction & Key Points
Hims sells personalized men’s and women’s health products with a direct-to-consumer (DTC) business model. It aims to allow users to more comfortably access sensitive prescriptions within areas like erectile dysfunction or hair loss, without going to an office or a pharmacy. Products are mailed right to a consumer’s door. It offers standard and personalized medicine, as well as subscriptions for customer savings & Hims retention boosts.
“Our historical strengths include developing a trusted brand, deploying technology to remove barriers to access, and providing access to personalized solutions at an affordable price.”
Founder/CEO Andrew Dodum
Despite being founded just 8 years ago, Hims is already nearing a $500 million quarterly revenue run rate, with great margins. It’s founder-led and competes with smaller vendors like Roman while increasingly competing with Amazon.
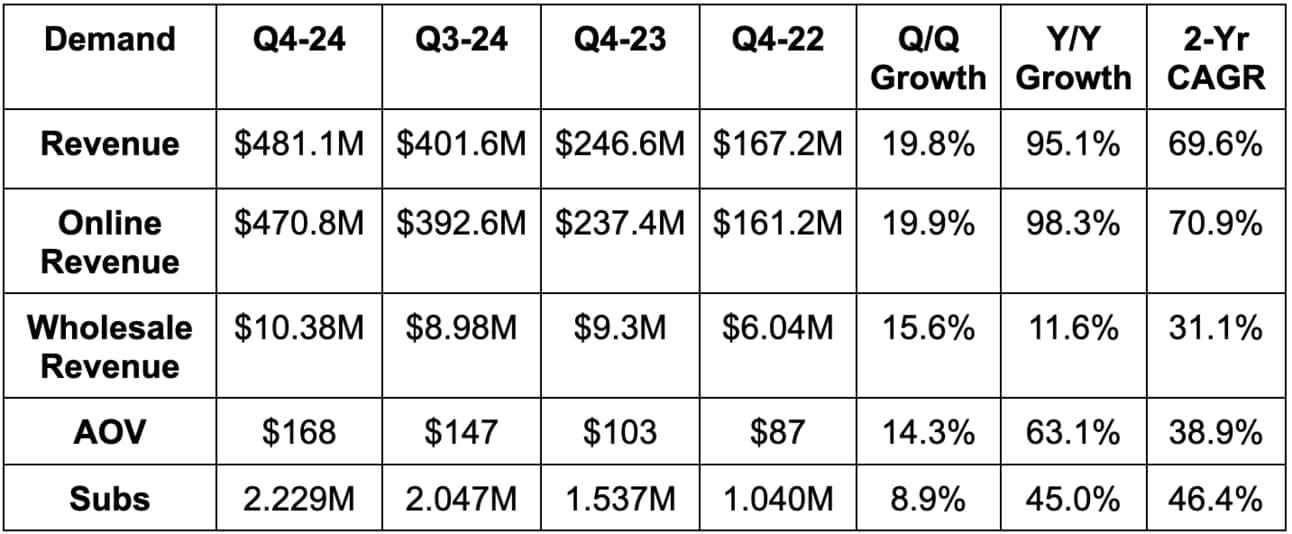
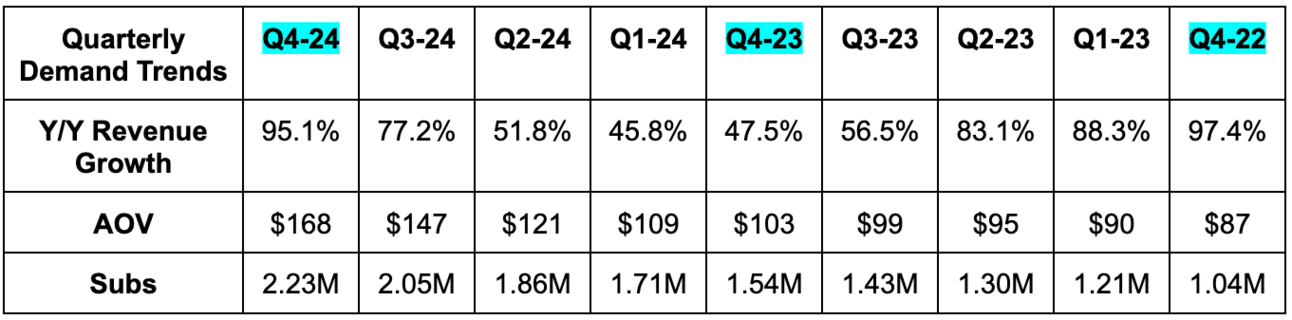
b. Demand
- Beat revenue estimates by 2.3% & beat guidance by 2.9%.
- Growth in 2024 excluding GLP1 (weight loss drugs) was still a lofty 43% Y/Y vs. 69% Y/Y for the whole company.
- GLP1 drugs now represent about 15% of revenue.
- Ex-GLP1, sequential growth for core segments has been roughly flat for the last two quarters. Dermatology has been a standout with great subscriber growth.
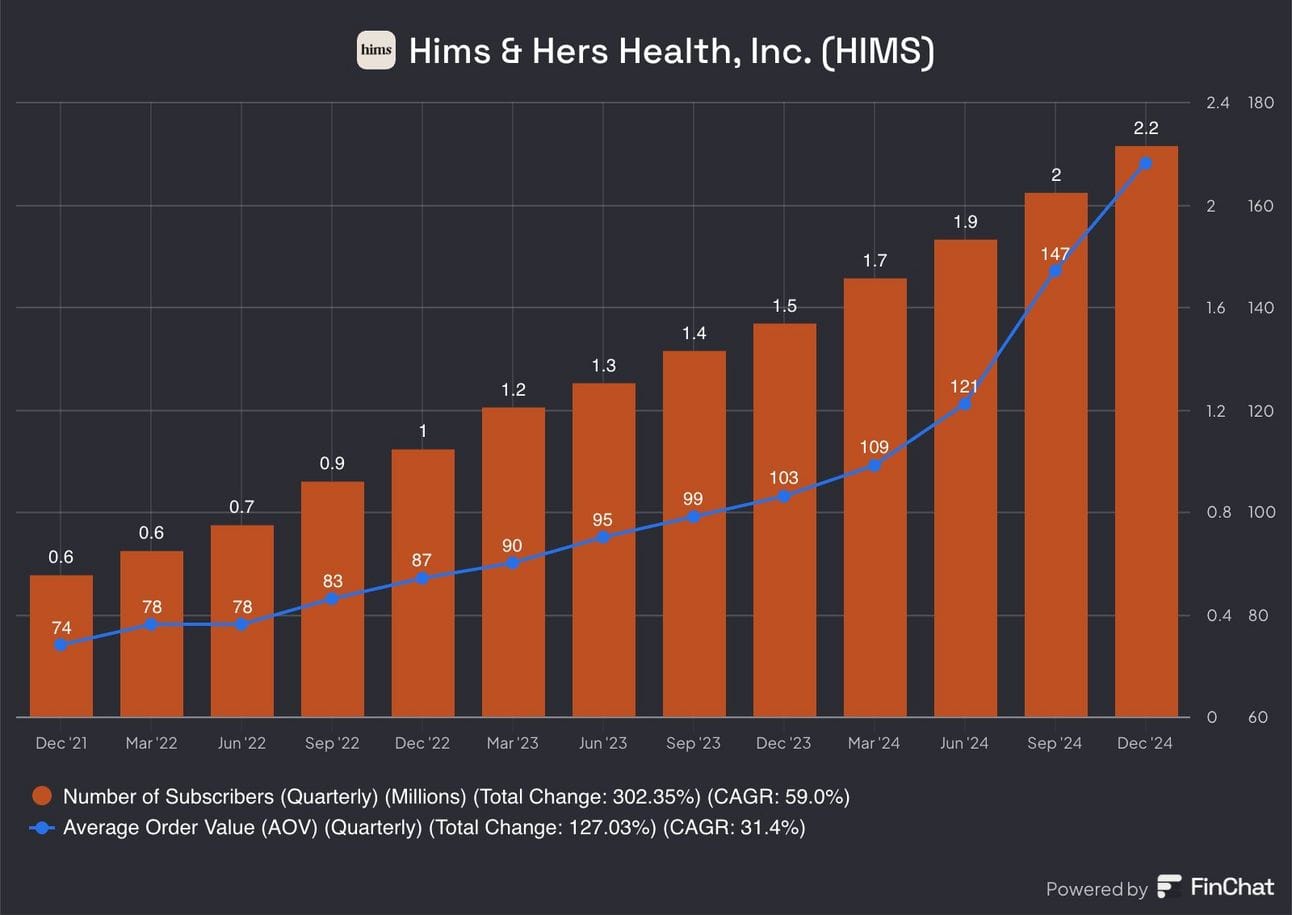
- Beat subscriber estimates by 0.4%.
- Beat average order value (AOV) estimates by 6%.
- Average revenue per user (ARPU) was $73 vs. $64 Y/Y.
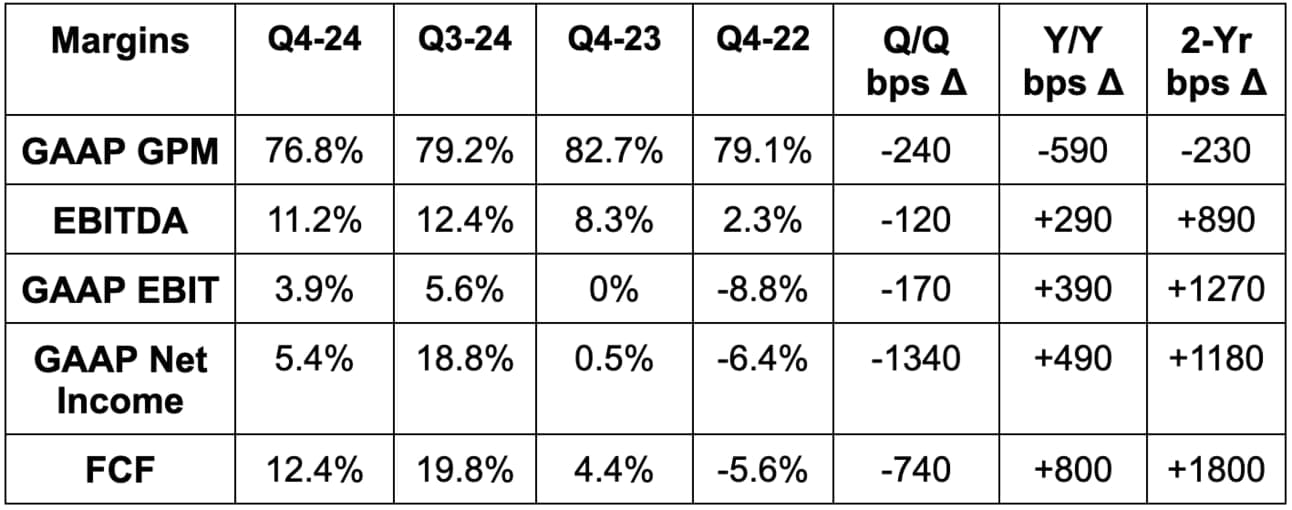
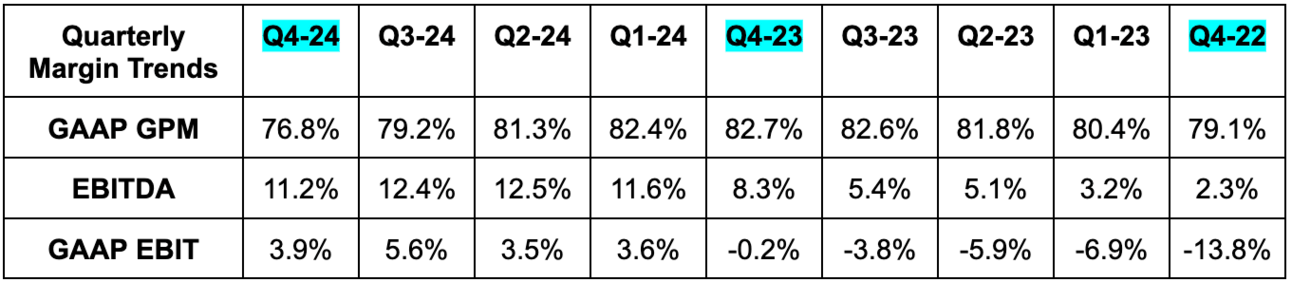
c. Profits & Margins
- Slightly beat EBITDA estimates & beat EBITDA guidance by 3%. EBITDA rose by 160% Y/Y.
- Strong leverage was enjoyed across all cost buckets besides technology & development.
- Missed 78.3% GAAP GPM estimates by 150 basis points (bps; 1 basis point = 0.01%). GPM contraction is due to investments in the weight loss platform and was as expected internally.
- Met $0.11 GAAP EPS estimate. EPS rose from $0.01 to $0.11 Y/Y (without any large tax benefits).
d. Balance Sheet
- $300M in cash & equivalents.
- $64M in inventory vs. $49M Q/Q.
- Diluted share count rose by 8.5% Y/Y.
- Basic share count rose by 3.5% Y/Y.
- No debt.