1. Taiwan Semiconductor (TSM) – Earnings Summary
Taiwan Semi builds chipsets for other companies like Nvidia and Qualcomm. It does so in its highly expensive, highly complex chip fabrication plants. These are called “fabs” for short.
Needed Definitions:
- Fab means a factory.
- Nanometer (NM) describes the chip technology. Smaller NM is more advanced as it uses smaller transistors. This means TSM can pack more transistors into a single chip while making those chips more energy efficient and cost-effective.
- “Advanced Technology” Revenue = revenue from 3nm (N3), 5nm (N5) & 7nm (N7) technology.
- Wafer refers to the raw materials (like silicon) that are used to manufacture chips and instruct the materials with desired tasks.
- Chip-on-wafer-on-substrate (CoWoS) is a packaging process that combines chips into a single unit.
a. Results
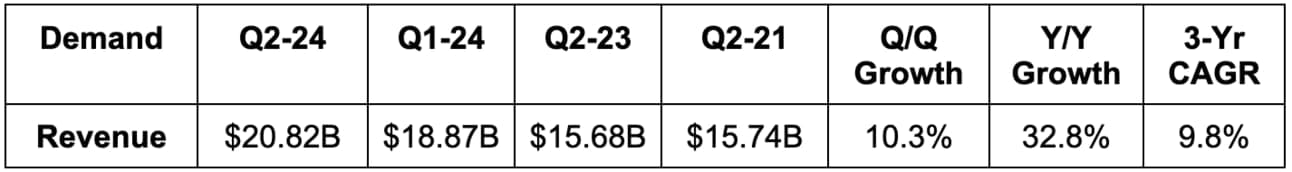
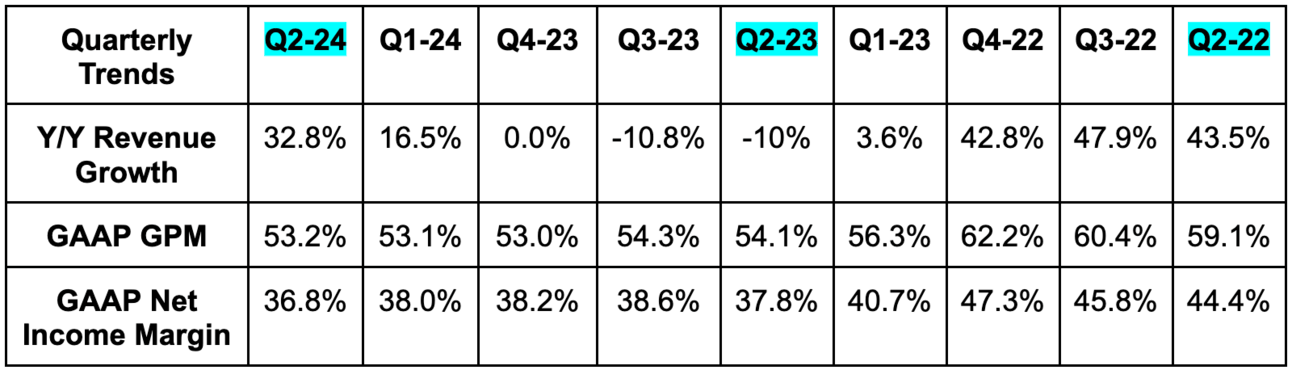
- Beat revenue estimates by 3.6% & beat revenue guidance by 4.1%. Its 9.8% 3-year revenue compounded annual growth rate (CAGR) compares to 13.5% Q/Q and 15.7% 2 quarters ago.
- Q/Q growth would have been 13.6% without currency headwinds.
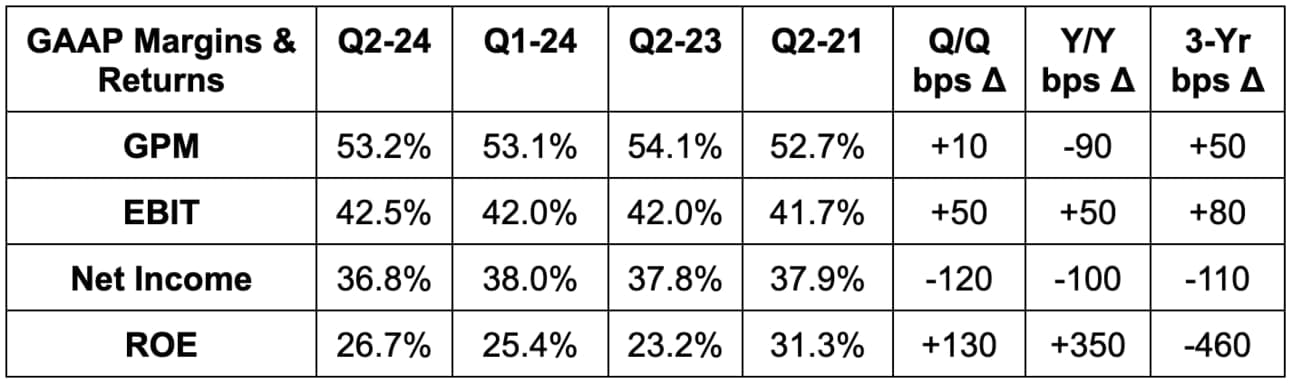
- Beat GAAP operating income (or EBIT) estimates by 5.5% & beat guidance by 8%.
- Beat 52.6% GAAP gross profit margin (GPM) estimates by 60 bps & beat guidance by 120 bps.
- Beat $1.42 GAAP EPS estimates by $0.06.
- Delivered a 25.5% FCF margin vs. 43.0% Q/Q and -17.3% Y/Y.
b. Guidance & Valuation
Q3 2024 guidance was 1.6% ahead on revenue, 4.4% ahead on operating income & 180 basis points (bps; 1 basis point = 0.01%) ahead of 52.7% GPM estimates.
For the full year, TSMC now expects to do slightly better than its mid-20% Y/Y revenue growth guide offered last quarter.
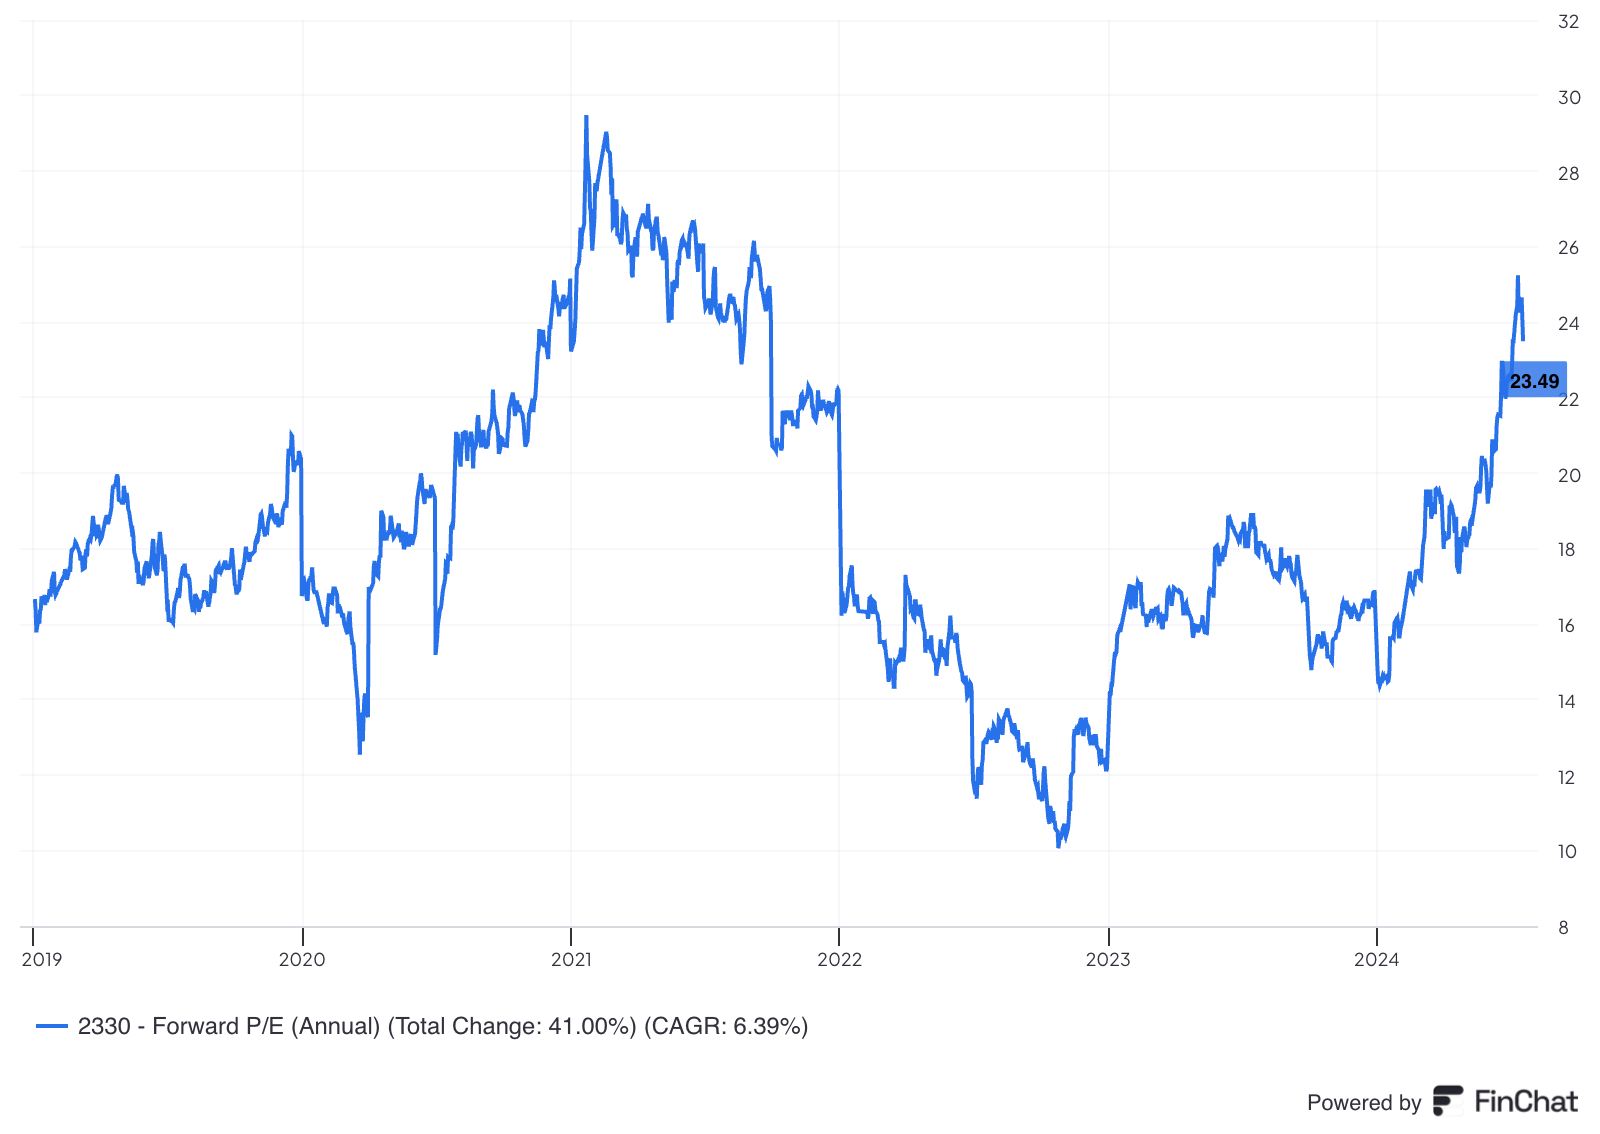
TSMC trades for 26x this year’s earnings estimates. Earnings are expected to grow by 24% Y/Y this year and 29% Y/Y next year. Here’s how its next-12 month earnings multiple compares to historical norms:
c. Balance Sheet
- $55.4B in cash & equivalents.
- Inventory rose 4.5% Y/Y. Days of inventory on hand fell from 99 to 83 Y/Y.
- $30B in bonds payable.
- Share count is flat Y/Y.
- Dividend payments rose 27% Y/Y.
d. Presentation & Call Highlights
Advanced Technology (7NM and Below):
Sub N7 technology made up 67% of its total wafer revenue vs. 53% Y/Y while high-performance compute (HPC) crossed 50% of total revenue for the first time. HPC is where the GenAI explosion shows most clearly in its product demand and overall financial success. Strong demand for the N3 and N5 technology was able to overcome some smartphone seasonality to facilitate the outperformance. Robust N3 shipment levels were also the source of its days inventory on hand decrease highlighted in the balance sheet section.
- HPC is 52% of revenue vs. 44% Y/Y; smartphone is 33% of revenue vs. 33% Y/Y; internet of things (IoT) was 6% of revenue vs. 8% Y/Y; auto was 5% of revenue vs. 8% Y/Y.
Gross Margin:
As a reminder, the ramps of its new nano-chip technologies always lead to gross margin dilution. It takes time for capacity to scale to a point of broader efficiency and higher profitability. Beyond this gross margin headwind, TSMC is also shifting some N5 production capacity to N3, which creates disruption and another 1 to 2 points of GPM headwinds for 2024. Both of these headwinds coincide with electricity inflation in Taiwan and its continued manufacturing expansion to higher-cost regions. Considering this, I found the 90 bps of Y/Y GPM contraction to be quite reasonable (and better than expected). Advanced tech scaling and the capacity shift will eventually turn to tailwinds towards the end of this year and into 2025.
The Q2 gross margin beat was due simply to better-than-expected capacity utilization vs. its forecast, which it expects to continue through Q3. “Better cost improvement efforts and productivity gains” were also GPM tailwinds during the quarter. The team was asked why it isn’t raising its 53% or higher long term GPM target, which it raised from 50% in 2021. All they were willing to offer is telling investors to focus on the “or higher” portion of its 53% or higher target. Wink, wink.
CapEx & TAM Expansion:
TSMC raised its CapEx guide for the year from $30 billion to $31 billion. About 75% of that will be for its advanced nano-chip process tech, 15% for specialty technologies and the remaining 10% for packaging, testing and other categories. This CapEx allocation leads us to an interesting idea: TSMC sees its broadening use cases greatly expanding its total addressable market (TAM) from $115 billion to $230 billion. It now sees overall foundry industry services including packaging and testing (not just creating an actual chip). Packaging includes storing and integrating chips with thermal protection, maintenance and connectivity tools too. Traditional foundry services make-up the actual creation of an integrated circuit (IC) or chip for a customer. The firm believes this new TAM definition “better reflects TSMC’s expanding market opportunities.” It had a 28% market share of this extended TAM definition in 2023, which it sees rising in 2024.
TSMC used to tell us that packaging margins would be inferior vs. its core foundry services. That is no longer the case as GPM for this segment approaches the rest of its business.
The team was also asked about potential geopolitical tensions, Trump’s comments on wanting the U.S. to control more chip manufacturing and Biden’s comments on more export restrictions. None of this has changed its overseas factory expansion plans in the slightest. Full speed ahead.
AI Mega-Trend:
“The continued surge in AI-related demand supports strong demand for energy-efficient computing. As a key enabler of AI applications, the value of our technology position is increasing as customers rely on TSMC to provide the most advanced process and packaging technology at scale in the most efficient and cost-effective manner.”
CEO C.C. Wei