
I published an update on my portfolio and performance vs. the S&P 500 earlier in the week.
Table of Contents
- 1. J.P. Morgan (JPM) – Earnings Snapshot & Economi …
- 2. Uber (UBER) – Encouraging Data
- 3. Amazon (AMZN) – Jassy Shareholder Letter & More
- 4. DraftKings (DKNG) – Market Share Data
- 5. Varying Degrees of Tariff Impacts & Tariff News …
- 6. Shopify (SHOP) – Founder Letter
- 7. Cloudflare (NET) – M&A
- 8. SoFi (SOFI) – Galileo & Data
- 9. Meta (META) – Llama 4 Introduction
- 10. Alphabet (GOOGL) — Various News
- 11. Headlines
- 12. Macro
1. J.P. Morgan (JPM) – Earnings Snapshot & Economic Commentary
Welcome back to earnings season. I’ll have the preview article out before my first holding reports and 40+ reviews sent to you all over the coming weeks. Can’t wait. For now, a more abbreviated earnings snapshot on an iconic bank:
The economic fallout from the current trade war was not felt during the Q1 period. Results for this recent quarter still come from a relatively tranquil and robust economic environment. Q2 is when weakness would potentially begin to show up, which is why guidance commentary is so important.
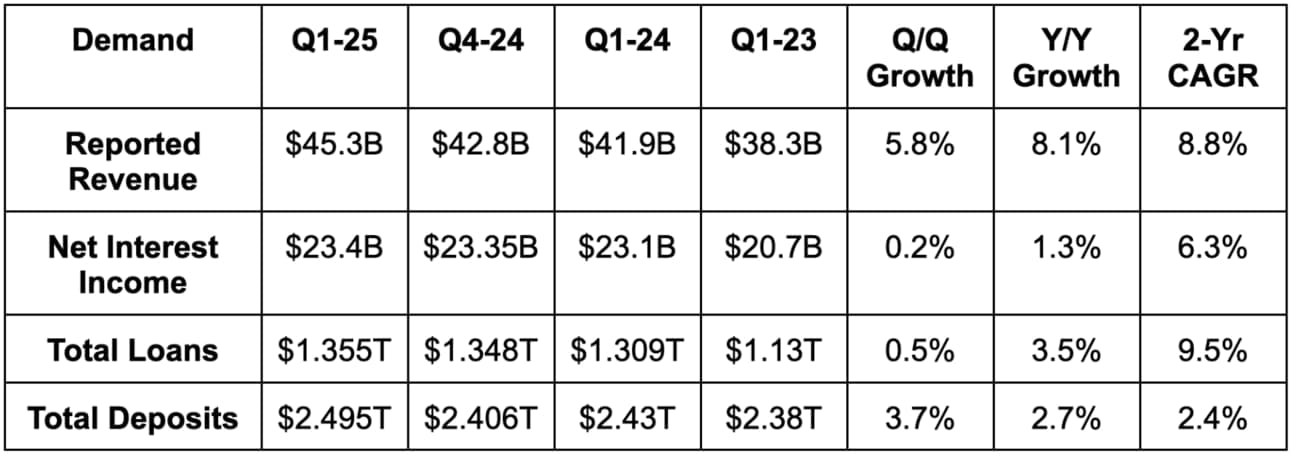
a. Demand
The company beat revenue estimates by 2.7%
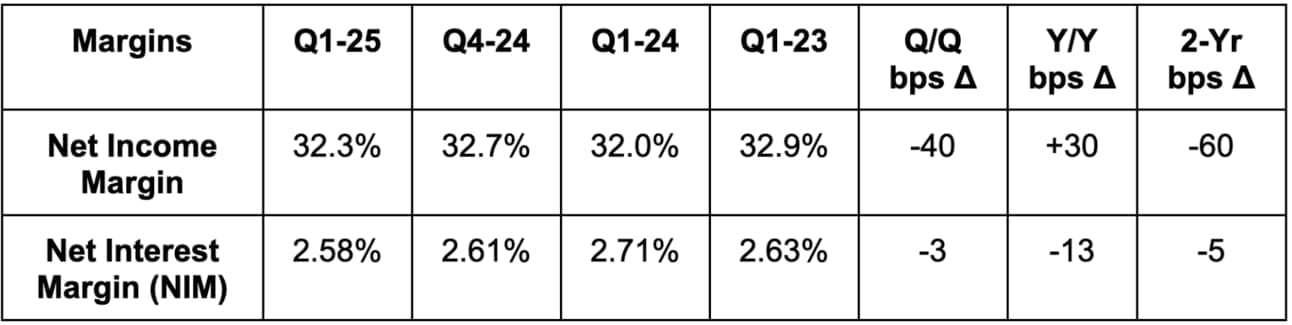
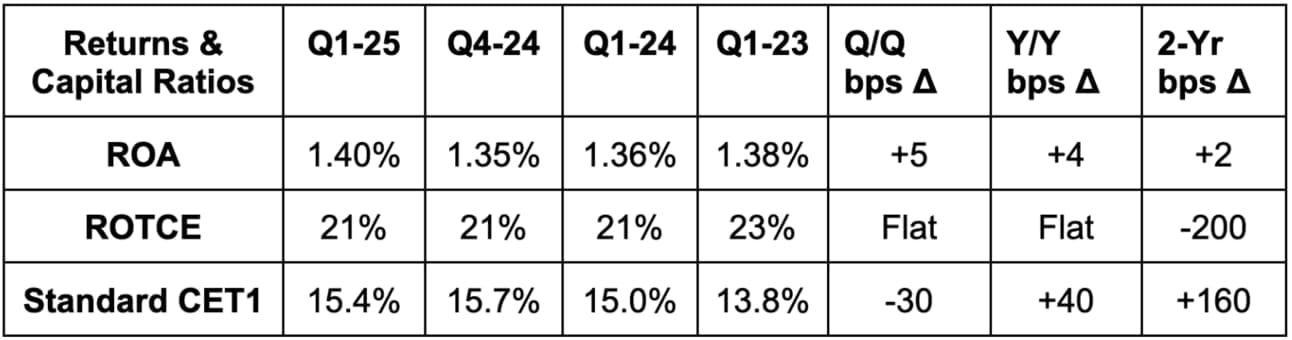
b. Margins, Returns & Capital Ratios
- Beat $4.64 GAAP EPS estimates by $0.43.
- Missed 2.62% net interest margin (NIM) estimates by 4 basis points (bps; 1 basis point = 0.01%).
- Beat book value estimates by 0.7%.
- Beat 1.33% return on asset (ROA) estimates by 7 bps.
- Beat 17% return on equity (ROE) estimates by 100 bps.
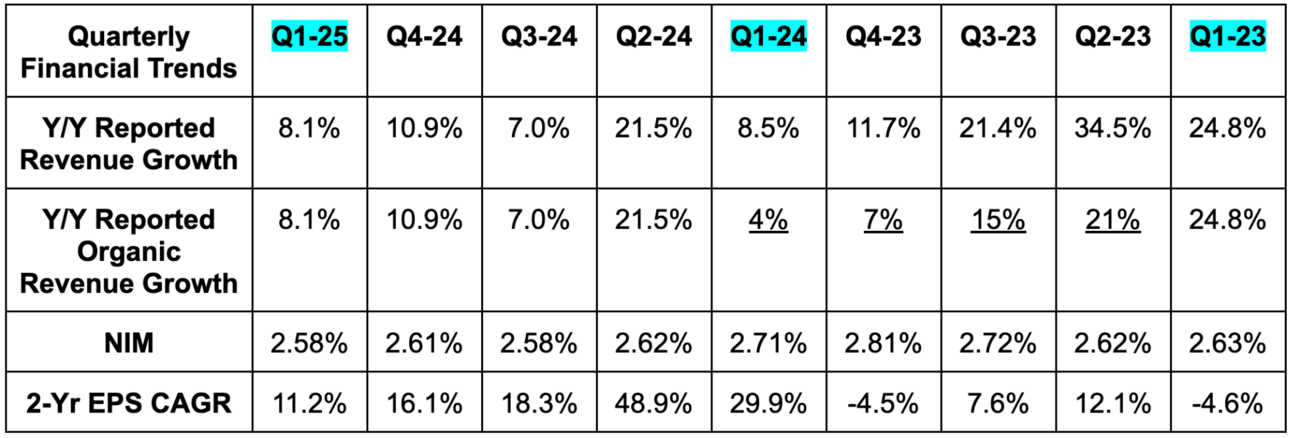
c. Key Quarterly Trends
d. Credit Data
In terms of important credit lingo:
- Delinquencies are loans that are past due by a number of days. Delinquency rates are the leading indicator for credit health.
- Net charge-offs are loans that a creditor decides won’t be repaid and will instead become losses. Net charge-off (NCO) rate is the percentage of loans classified as uncollectible. This is a lagging credit indicator compared to the leading delinquency indicator.
- Reserve levels refer to the amount of funds set aside to cover potential losses for the overall portfolio. Reserves and provisions (which are also for covering potential losses for specific types of credit) are tightly positively correlated.
- Higher expected delinquencies and NCOs contribute to reserve building.
- As reserves and provisions build, allowance for credit losses grows. This is the overall balance of funds to cover losses.
Some brief thoughts on the data below:
- Good to see Q/Q & Y/Y stability in 90+ day card service delinquency rates (DQRs).
- Provision growth shows them hunkering down for higher losses amid the trade war.
- Not ideal to see net charge-off rates overall and for card services rising.
- While this data is extremely important, nothing but forward-looking provisions reflect the starkly different environment companies find themselves in for Q2 vs. Q1.
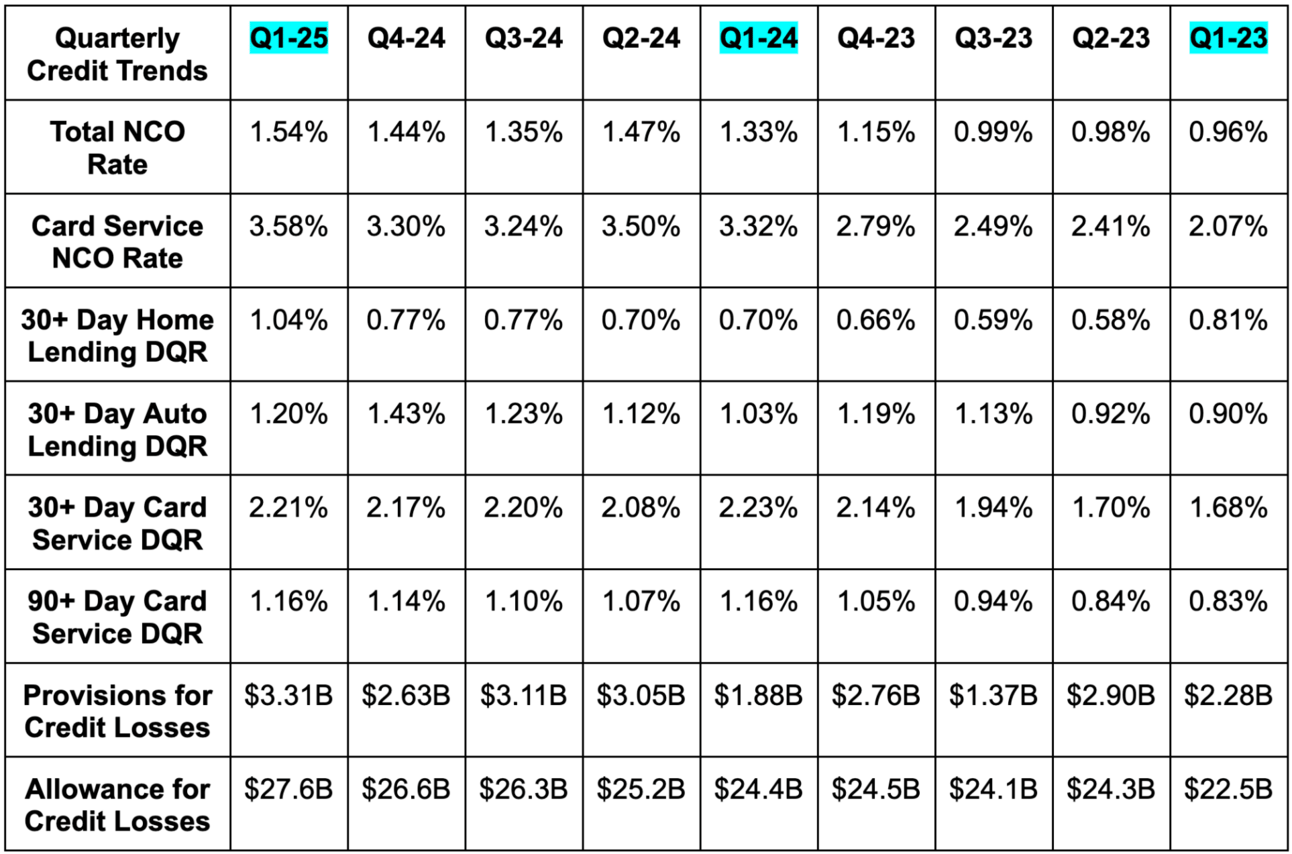
Granular NCO, Provision & Allowance Context:
- The rise in NCO rate was due to higher card service NCOs and higher banking and wealth management NCOs too.
- Consumer & Community Banking (CCB) provisions were $2.63B vs. $2.62B Q/Q & $1.91B Y/Y.
- Commercial & Investment Banking (CIB) provisions were $705M vs. $61M Q/Q & $1M Y/Y.
- Asset & Wealth Management (AWM) provisions were -$10M (a good thing) vs. -$35M Q/Q & -$57M Y/Y.
d. Guidance, Valuation & Important Leadership Quotes
Guidance:
JP Morgan reiterated expectations for $90B in net interest income excluding the volatile global markets business. Its expectations for global markets performance actually improved a bit Q/Q. It also reiterated card NCO rate expectations of 3.6% for 2025. The theme of this call was “things are still pretty good and going well but we are highly mindful of the volatile macro backdrop and approaching it cautiously.” They’re building cash reserves and boosting their CET1 ratio. Still, that caution wasn’t enough to cut guidance, which I found encouraging.
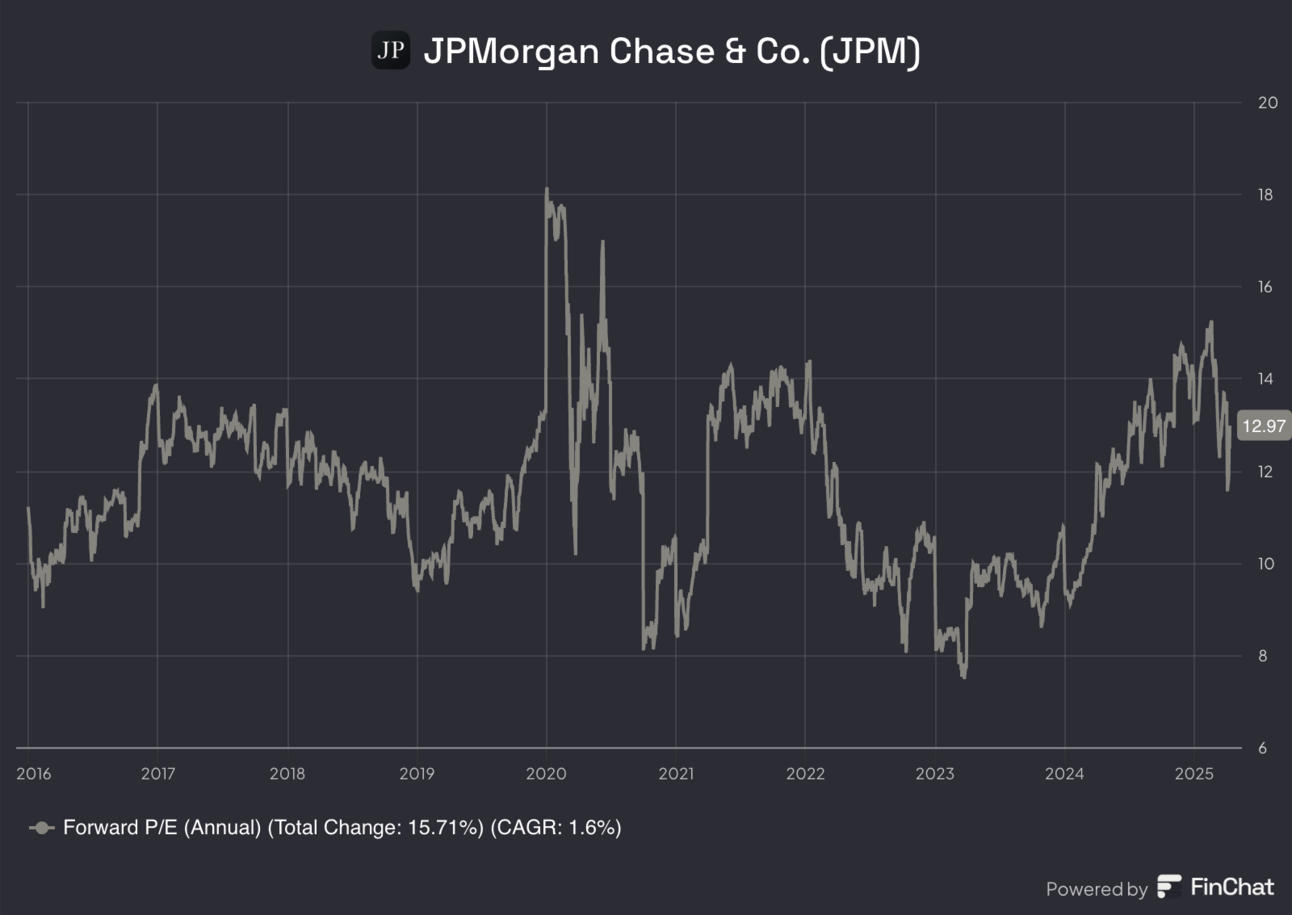
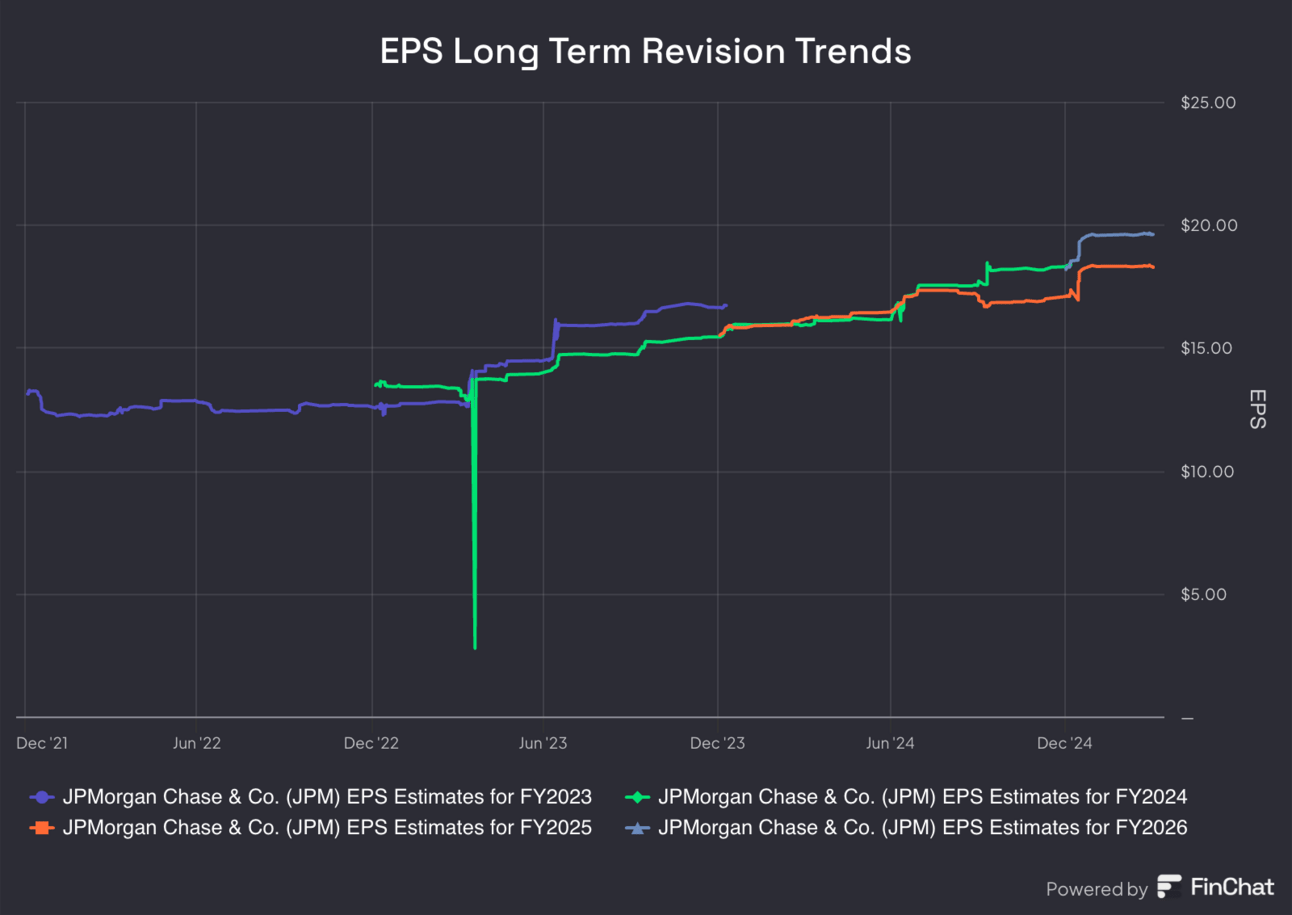
Valuation:
Based on current forward estimates (which will be based on unknown geopolitical outcomes and are inherently uncertain today) JPM trades for about 12x forward earnings with the quarterly beat. As of right now, EPS is expected to fall by 8% Y/Y and rise by 7% Y/Y next year. For more context, the company’s EPS compounded at a 28% clip during 2023 and 2024.
Important Quotes:
“We continue to believe it is prudent to maintain excess capital and ample liquidity in this environment… We have an extraordinary amount of liquidity, with $1.5 trillion of cash and marketable securities. The economy is facing considerable turbulence, with the potential positives of tax reform and deregulation and the potential negatives of trade wars, ongoing sticky inflation and high fiscal deficits. As always, we hope for the best but prepare the Firm for a wide range of scenarios.”
CEO Jamie Dimon opening remarks
“Our Q1 allowance is anchored on the relatively benign base case outlook. Due to the significantly elevated risks & uncertainties, we increased the probability weightings associated with the downside scenarios in our underwriting framework. As a result, the unemployment rate embedded in our allowance is 5.8% vs. 5.5% last quarter (unemployment currently at 4.2%). This drove a $973M rise in the allowance, with a consumer build of $441M driven by changes in the macro outlook.”
CFO Jeremy Barnum
“Consumer balances have stabilized.”
CFO Jeremy Barnum
“It's important to note that the increase in the allowance is not, to any meaningful degree, driven by deterioration in the actual credit performance in the portfolio, which remains largely in line with expectations.”
CFO Jeremy Barnum
2. Uber (UBER) – Encouraging Data
Thank you to Bloomberg for publishing the Yipit chart this week. That company does great research, but has asked me not to share their private data anymore. Considering Bloomberg posted it, I think this is fair game.
So far so good for Waymo and Uber in Austin. Through the first 27 days of operation, ride volume is 80% higher than in San Francisco, with larger leads compared to Phoenix and LA. Austin is the only place where Waymo is only available on Uber, as that AV vendor experiments with several business models. The ultimate model selection will be based on maximum utilization rates more than anything else. Yes, route optimization, fleet management and payment orchestration are all positive features for Uber to offer partners. But still, utilization rate matters the most and this data is positive.

This is how Uber can demonstrate proof of concept to win a closer relationship with Waymo and to keep rounding out its budding roster of other partners. And while many think Tesla and Google are the only two players in town, I would strongly respond with a “not so fast. Zoox is coming… AVRide is coming… Mobileye is coming… Wayve is coming… Oxa, Motional, Wasabi, Nuro and AutoBrains are coming… BYD and Pony AI are coming. Many of these companies have AV deployments set for 2025 and most of them are already partnering with Uber. ALL of these players are surely paying attention to Uber’s impact in Austin. As more of these vendors succeed in deployments, Uber’s positioning strengthens. It’s a lot easier to argue that you deliver better utilization with this tangible Waymo data AND in a fragmented market where no hardware vendor can mirror the network effect that Uber has as a demand aggregator.