This piece is powered by my friends at Savvy Trader:

Welcome to the 1,047 new readers who have joined us this week. We’re so happy to have you.
1. PayPal (PYPL) – Q3 2022 Earnings Review
“We are confident that we have turned a corner in our transformation. We will continue to drive cost savings and streamline processes to improve productivity while investing to differentiate our value proposition, drive market share & deliver on our commitments.” – PayPal CEO Dan Schulman
A. Demand
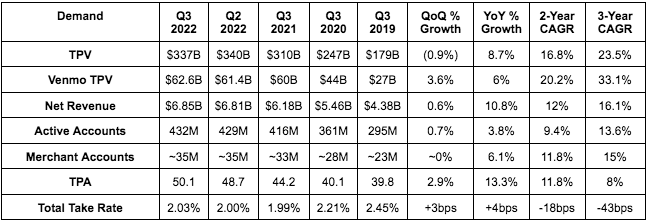
PayPal beat its $6.8B revenue guide by 0.7% and analyst estimates by 0.4%.
More Demand Context:
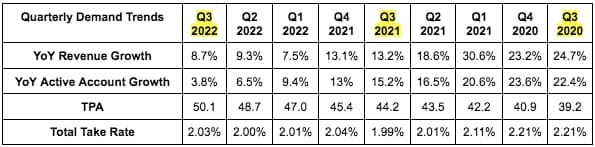
- PayPal’s 3-year sales CAGR of 16.1% compares to 16.5% last quarter & 16.2% 2 quarters ago.
- Foreign Exchange (FX) was just a 100bps growth headwind during the quarter vs. 500 bps last quarter. eBay was another 100 bps but its managed payments migration impact on PayPal’s growth is now officially in the past.
- More effective currency hedging helped a lot here. Specifically, FX hedging was a $156M benefit vs. a $44M headwind YoY. This benefit counts as international transaction revenue.
- That hedging doesn’t benefit volume growth, which is why Total Payment Volume (TPV) experienced a 500 bps FX growth headwind this quarter.
- Strong Transaction per Account (TPA) growth is PayPal’s evolution to high engagement users (& use cases to limit churn) working.
- Take rate compression is via Bill Pay, Venmo and Braintree growth as well as eBay’s migration. That reversed this quarter thanks to the eBay headwind dissipating and Venmo monetization improvement (its commerce volume grew 150% YoY).
- Active account growth includes a large chunk of the churn impact from PayPal halting promotional activity for low engagement, cash burning users as part of its shift to focus on higher value users.
- PayPal’s core Daily Active users are up 40% since pre-pandemic.
- PayPal continued to outgrow e-commerce this quarter & take or maintain share in all core markets.
- Venmo crossed 90 million users during the quarter.
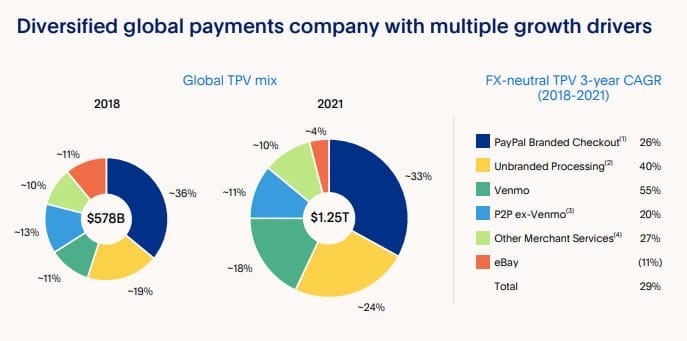
PayPal broke down TPV contribution by product for the first time ever this quarter (THANK YOU) and how that contribution has trended since 2018:
B. Profitability
- PayPal’s GAAP EPS beat analyst expectations by 82%.
- PayPal beat its EPS guide of $0.95 by 13.6% (analysts expected the same).
- This would have been a 25% beat with normalized YoY tax impacts.
- PayPal beat analyst EBIT expectations of $1.36B by 12.5%.
More Context on Margins:
- Transaction margin (and so most other margin lines) benefited greatly during the pandemic from stimulus checks temporarily boosting the usage of debit as a % of PayPal’s total volume. Debit comes with lower 3rd party fees vs. credit and has since normalized.
- Other things like lapping credit reserve releases, eBay take rate compression, cross border struggles (FX-related) are all currently weighing on YoY margins. Luckily, management expects operating leverage to kick in going forward.
- GAAP EPS was boosted by $0.38 in mainly equity investment gains with a bit of credit reserve release help as well. That’s why the GAAP EPS beat was larger than the non-GAAP beat.
- This was the first quarter of YoY operating income growth in over a year and a record quarter for cash flow generation.
C. Balance Sheet

- Accelerating purchases into share price declines is how a buyback program is supposed to look… “cough, cough Meta”
- PayPal added $500M to the cash & equivalents pile QoQ to bring the total to $16.1B. It has $10.7B in total debt.
- Buybacks this year have represented 78% of PayPal’s total cash flow generation.
D. 2022 Guidance & Preliminary 2023 Notes
Rest of 2022:
- PayPal lowered its previous revenue growth guide of 10% (11% FX neutral) to 8.5% (10% FX neutral). This implies revenue of $27.5B which missed analyst estimates by 1.4%. This is actually better than most of its competitors fared during the quarter, believe it or not.
- The weakness is because of the early holiday season shopping that occurred in 2021 not recurring this year. That reality has been true across all available 3rd party data -- so not just for PayPal.
- PayPal lowered its previous TPV guide of 12% growth (16% FX neutral) to 8.5% growth (12.5% FX neutral).
- The larger volume guide down vs. revenue guide down is the hedging effect discussed above. Hedging doesn’t help volume growth like it does revenue growth.
- PayPal lowered its Net New Active (NNA) guide from 10 million to 9 million.
- PayPal raised its GAAP EPS guide by 35% from $1.57 to $2.12. It also raised its EPS guide by 4.1% from $3.92 to $4.08 for 2022.
- PayPal reiterated over $5 billion in 2022 free cash flow.
“Given challenging macro, slowing e-commerce trends and an unpredictable holiday shopping season, we are being appropriately prudent with our Q4 revenue guide.” – CEO Dan Schulman
2023:
- PayPal offered EPS growth guidance of AT LEAST 15% for 2023. This equates to at least $4.70 in 2023 EPS vs. expectations of $4.82.
- Considering how pessimistic this 2023 guide sounded and the “at least” context, I wouldn’t call this a miss.
- This guide does not rely on any improvement in macro or e-commerce trends. Per CEO Dan Schulman, “if the macro picture gets better, these numbers could improve dramatically.” But it’s expecting the terrible macro to persist.
- PayPal raised its 2023 operating leverage guide from 50 bps to 100 bps.
- PayPal guided to taking more e-commerce market share in 2023.
E. Notes from the Call
PayPal is working with Apple on the Following Initiatives (my favorite part of the call):
- Using iPhone “Tap to Pay” to allow U.S. merchants to conduct contactless debit/credit/mobile wallet payments with an iPhone on the PayPal & Venmo apps.
- No longer will merchants need a separate piece of hardware to function as an integration bandaid.
- In the first half of 2023, Apple Wallet users will be able to add PayPal & Venmo cards. Google did this in Germany and saw a 20% lift in its transaction volume from that move alone. PayPal’s scale & its consumer preference are powerful.
- PayPal is adding Apple Pay as a payment option for the Commerce Platform. This is already available for PayPal’s Braintree.
On Upgrading Checkout:
- PayPal launched a new software development kit (SDK) enabling 2-click checkout all natively within the merchant’s site. In-line checkout (so never leaving the merchant site to complete a transaction) boosts conversion considerably.
- Schulman discussed some upgrades around SMS authentication and biometrics and how they lowered PayPal checkout latency by 40% YoY.
- PayPal is beta testing 1 click checkout with select merchants. This is only possible with massive payment vaults and vast quantities of stored consumer information to expedite completion. PayPal has that.
- PayPal’s point of sale (POS) software Zettle is now live in the U.S. after successful launches in France and Netherlands this year.
- Buy Now, Pay Later (BNPL):
- PayPal’s BNPL volume grew 157% YoY to $5B
- PayPal now has 280,000 merchants with upstream presentment (showing the PayPal checkout option before a customer checks out) vs. 200,000 QoQ. This raises its share of overall checkout by double digit percentages.
- PayPal’s loss rates are “among the lowest in the industry with no observable deterioration” per Schulman. Music to my ears.
- PayPal leadership reiterated its plans to secure non-balance sheet funding for this credit product like it did with other U.S. receivables in the past. It wants to remain asset light. Paging Synchrony Bank.
- Wall Street Journal ranked PayPal #1 overall for Buy Now, Pay later (BNPL) value prop.
- Braintree won several “large new merchants” during the quarter.
F. My Take
It’s hard for me to say this was a good quarter with the small revenue growth miss… but I do think there were many more positives than negatives. Despite all of the chaos, the team is effectively managing costs and continues to take market share in a competitive space. That sets it up well for when the exogenous backdrop improves. Furthermore, I find it extremely heartening to see PayPal and Apple strengthening their relationship as it was the most pressing and formidable competitive threat I saw for PayPal in the U.S. I also appreciated the preliminary 2023 outlook. My position at this point in time is largely full, and I have no interest in selling any shares. This performance was satisfactory in my view.
2. Progyny (PGNY) — Q3 2022 Earnings Review
“We remain the provider of choice for the most successful companies in the world and remain in our strongest and best competitive position given no other benefit provider has built a fully managed solution of our quality & outcomes.” – Progyny CEO Peter Anevski
A. Demand
Progyny generated $205.4M in sales, beating its guide 6.1% and analyst estimates by 5.7%.
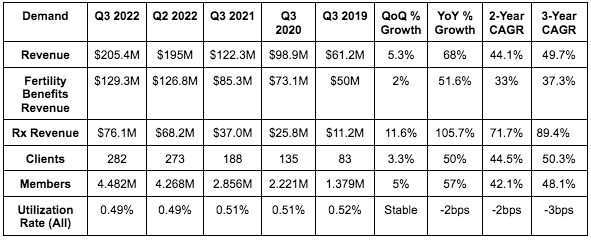
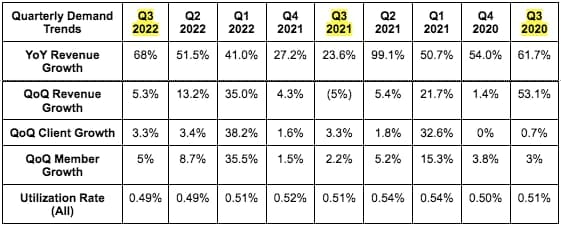
More Context on Demand:
- This large beat and raise is DESPITE a $10M unexpected revenue hit from the industry-wide Menopur medication shortage due to supplier issues. There has been no recall and the issue is expected to be resolved swiftly… but Progyny’s 2022 guide assumes it to be permanent. The company sharply beat demand forecasts anyway and there could be even more upside if it’s resolved as expected.
- Progyny maintained near-100% gross client retention for the 7th straight year following the 2022 selling season.
- Progyny’s member interest and engagement has fully returned to pre-pandemic levels.
- Progyny enjoyed a record number of early deployments this quarter. This pulled some growth forward, but strong 2022 and 2023 selling season commentary (discussed below) is a sign of more of the same rapid growth we expect to come.
- New clients boasted a Progyny Rx adoption rate of 97% vs. a previous company record of 92%. With this progress, Progyny expects total Rx adoption to rise from 84% to 90% next year.
- Progyny’s 3-year revenue growth CAGR of 49.7% compares to 51.4% last quarter and 53.9% 2 quarters ago.
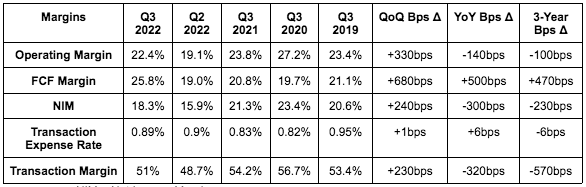
B. Profitability
- Progyny generated $35 million in adjusted EBITDA, beating analyst estimates and its own guidance by 14.2%.
- Progyny earned $0.13 per share, beating analyst estimates and its own guidance by $0.10 and more than quadrupling net income estimates as well.
- Note that Progyny’s guidance does not include income tax benefits which it continued to enjoy this quarter
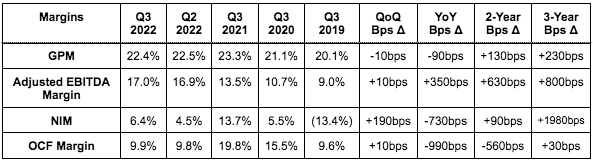
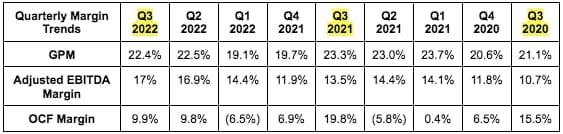
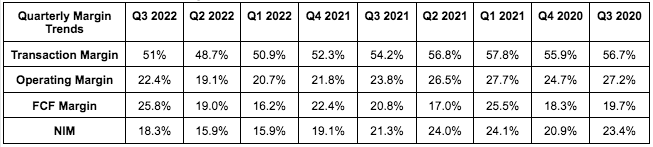
More Context on Margins:
- A stock grant that Progyny paid out to hire and retain talent was the source of the falling margins YoY. That’s why adjusted EBITDA margin conversely expanded.
- For NIM specifically, the decline YoY was due to the stock comp and also $5 million less in income tax benefits YoY. It would have grown with just the stock comp headwind and the same YoY tax benefit.
- Cash flow margins are also being impacted by Progyny lengthening the cash collection cycle as part of renegotiated Progyny Rx contracts. This allows Progyny to collect more total cash flow over time, but the payment now takes 6 months to begin ramping. So? Rapid Rx growth like its enjoying now doesn’t equate to more cash flow in the near term, but will eventually.
- Progyny’s incremental EBITDA margin was 22.2% vs. 21.7% QoQ and 27.5% YoY. This points to 500+ bps of more operating leverage ahead.
C. Balance Sheet
Progyny’s balance sheet is ideal. It has $141M in cash & equivalents vs. $122.4M QoQ. It is deeply cash flow positive and has no debt. Diluted share count shrank slightly YoY & QoQ.
D. Guidance
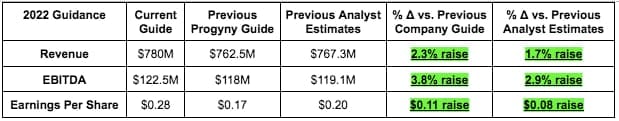
Progyny’s Q4 2022 guide was ahead on revenue and earnings, but slightly below on EBITDA. This isn’t concerning to me considering the full year EBITDA guide rose materially. It expects margins to fall QoQ (normal seasonality).
None of Progyny’s clients have conducted large scale layoffs to date. But it does not expect existing client headcount to grow in 2023. That’s usually a ~100-500 bps contributor to growth.
E. Call Notes
On a Strong 2022 Selling Season:
“The results we achieved in our 2021 selling season had been favorably impacted by pandemic demand carryover. This set a high bar for 2022 success and we are pleased that our selling season this year resulted in a record 105 new client commitments and 1.2 million covered lives…. This demonstrates strong conviction that employers have to add fertility to health plans given its increasing relevance to the workforce.” -- CEO Peter Anevski
- This 2022 client growth equates to nearly 40% YoY expansion which beat Progyny’s previously implied expectations of at least 32% YoY growth.
- 25% of Progyny’s existing clients expanded their benefit for 2023.
- Progyny is starting to enjoy more 5-year renewals (vs. all 3 year before) from some of its largest clients as a sign of faith in the company.
- Progyny now represents 40 industries vs. 30 YoY. Once it enters a new field, that generally serves as a domino for close competitors of the client to follow suit to more effectively compete for talent. The tight labor market today merely adds to that tailwind.
- 50% of Progyny’s client wins were from clients without any existing coverage and it still serves less than 5% of its target market. The runway is long and the greenfield opportunities remain robust.
“Given the strong sales season, as well as our expected near 100% client retention rate, we’re enthusiastic about the year ahead.” CEO Peter Anevski
On the 2023 Selling Season:
“[Macro weakness] pushed some accounts to delay deployment. Many are eager to revisit in January which sets us up with a larger and healthier pipeline than what we had this time last year.” – CEO Peter Anevski
On the Competitive Environment:
Progyny leadership was asked about competition winning some big clients. That was because of Progyny’s unwillingness to cut corners on its coverage like those employers were asking by doing things like implementing dollar maximums or excluding services. So those employers looked to other providers to cut the corners for them.
F. My Take
Wonderful quarter. Wonderful guide. Wonderful company. Enough said.
Savvy Trader is the only place where readers can view my current, complete holdings. It allows me to seamlessly re-create my portfolio, alert subscribers of transactions with real-time SMS and email notifications, include context-rich comments explaining why each transaction took place AND track my performance vs. benchmarks. Simply put: It elevates my transparency in a way that’s wildly convenient for me and you. What’s not to like?
Interested in building your own portfolio? You can do so for free here. Creators can charge a fee for subscriber access or offer it for free like I do. This is objectively a value-creating product, and I’m sure you’ll agree.
There’s a reason why my up-to-date portfolio is only visible through this link.

3. Penn Entertainment (PENN) — Q3 2022 Earnings Review
A. Demand
Penn generated $1.63B in sales, beating analyst estimates of $1.58B by 3.2%.
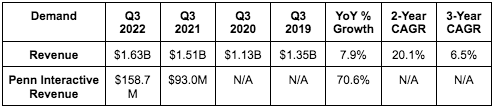
More Context on Demand:
- Penn’s 6.5% 3 Year revenue CAGR compares to 7.2% last quarter & 7.0% the quarter before.
- Penn Interactive is Barstool and Score Media. This was not disclosed as a separate revenue stream until 2021.
- Growth here includes an inorganic Score Media contribution.
- YoY Interactive growth was 95% YoY when normalizing the YoY impact of gaming tax reimbursements.
- The pandemic hit Penn’s regional casino business hard. That’s why the 2-Year CAGR was so strong. This is a 5%-8% revenue growth business. Don’t expect 20% with normal comps.
- Multi-channel guests are up 25% YoY as Penn Interactive begins to work its magic.
- Penn’s mywallet (contactless digital wallet) is now at 92,000 users vs. 70,000 QoQ.
- Penn’s regional casino handle share ex-Nevada FELL from 19% to 18% QoQ.
B. Profitability
- Penn earned $472M in adjusted EBITDA, beating analyst estimates of $466M by 1.3%.
- Penn earned $0.72 in EPS, beating analyst estimates of $0.49 by 47%.
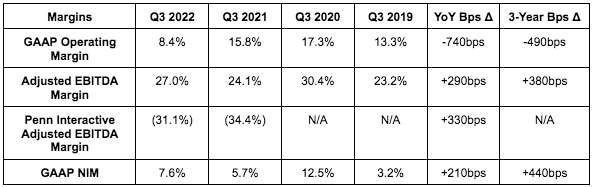
More Context on Margins:
- Penn Interactive turned profitable in October & Penn reiterated that it will be profitable next year. That compares quite nicely to DraftKing’s and its $500M+ EBITDA loss guide for 2023.
- Property level revenue boasted a 37.3% adjusted EBITDA(R) margin vs. 37.1% QoQ & roughly 35.2% YoY.
- Margins were hit all by $20 million in California lobbying expenses and a processing fee adjustment.
C. Balance Sheet
- Penn has $1.7B in cash & equivalents and nearly $1B in net debt. The net debt position rose slightly due to $168M in buybacks during the quarter. $211M remains on Penn’s $750M buyback plan.
- The debt is 85% fixed rate which is important in our rising rate environment.
- Penn’s lease adjusted net leverage ratio is 4.3X vs. 4.1X start of year (also due to buybacks).
- Penn drew a lot of criticism last month for the timing of its new brick and mortar expansion/upgrade projects. Out of the $850M in planned cost, $575M is being covered by a low interest rate credit revolver from Gaming and Leisure Properties with a $50 million grant from Aurora Illinois to further minimize cash outlay needs.