
Table of Contents
- 1. Nike (NKE) – Earnings Review
- 2. Tesla (TSLA) – Deliveries Contextualized
- 3. Interesting Sell Side Notes
- 4. Updated EBIT Comp Sheets
- 5. Hims & Hers (HIMS) – FDA
- 6. Amazon (AMZN) – More Margin Tailwinds & In-Pers …
- 7. Nu (NU) – Price Action
- 8. SoFi – Quick News
- 9. Headlines
- 10. Macro
Max subscribers — my portfolio has not changed since the last update.
1. Nike (NKE) – Earnings Review
a. Demand
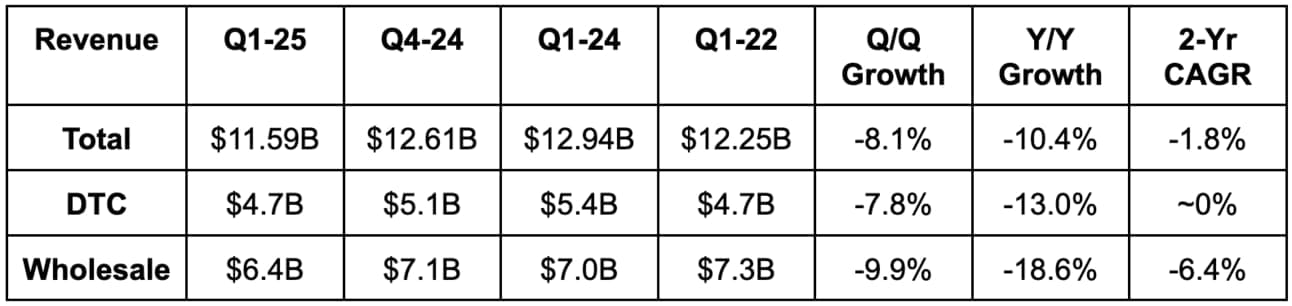
- Total revenue missed estimates by 0.5%.
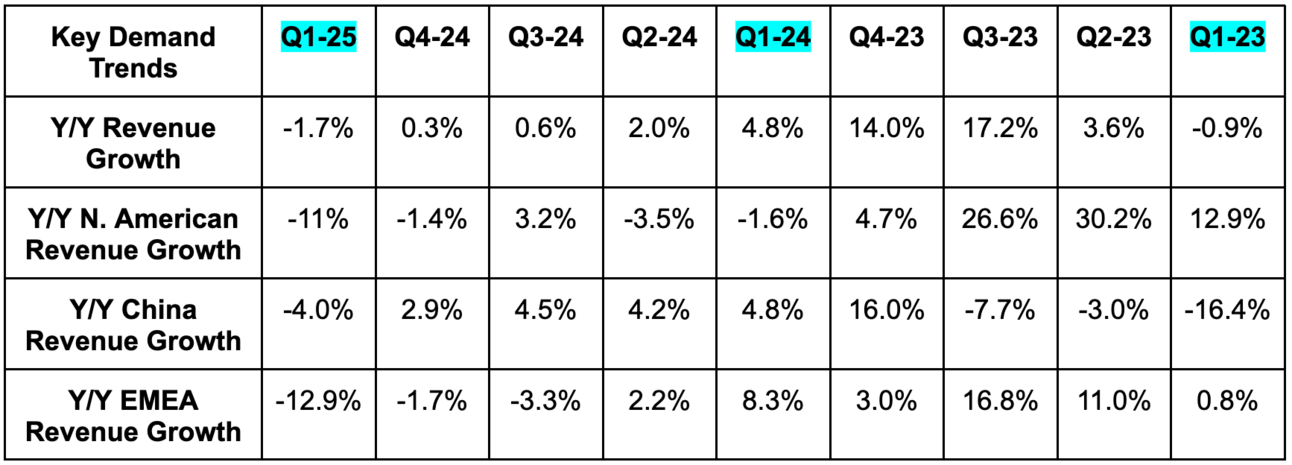
- North American revenue roughly met estimates; Europe, Middle East, & Africa (EMEA) revenue missed by about 4%; China beat by about 3%; Asia Pacific & Latin America beat by 1.4%.
- Revenue declined across all geographies and channels besides growth in Latin American and Chinese wholesale.
- North America revenue declined by 11% Y/Y. This compares to a 1% Y/Y decline last quarter.
- EMEA revenue declined by 13% Y/Y. This compares to a 1% Y/Y decline last quarter.
- China revenue declined by 3% Y/Y. This compares to 3% Y/Y growth last quarter (last quarter greatly benefited from extended holiday season).
- Direct-to-consumer (DTC) revenue beat estimates by 2.5%.
- Wholesale revenue missed estimates by 2.5%.
- Revenue fell by 9% Y/Y on a foreign exchange neutral (FXN) basis.
b. Profits & Margins
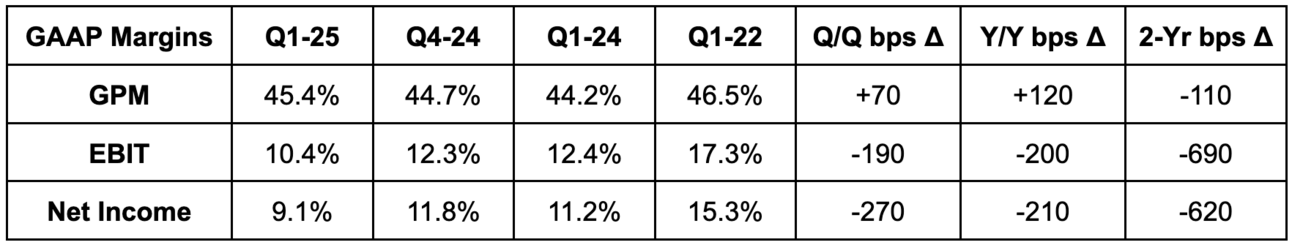
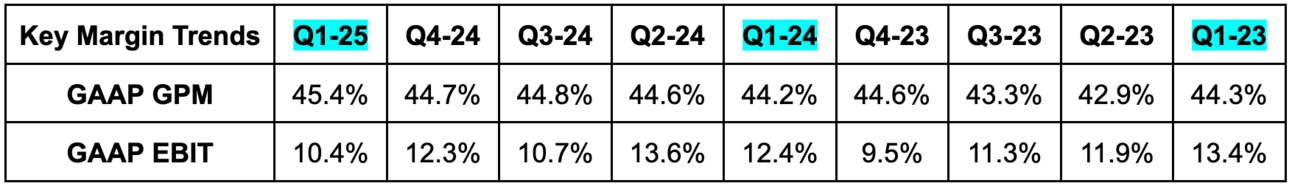
- Beat 44.4% GAAP gross profit margin (GPM) estimates by 100 basis points (bps; 1 basis point = 0.01%).
- Beat EBIT estimates by 1.5%.
- North American EBIT dollars declined by 15.2% Y/Y vs. 5.2% Y/Y growth last quarter and 4.1% Y/Y growth last year.
- EMEA EBIT dollars declined by 14.8% Y/Y vs. 2.0% Y/Y growth last quarter and -4.6% Y/Y growth last year.
- Greater China EBIT dollars declined by 4.4% Y/Y vs. 3.6% Y/Y growth last quarter and a 3.0% Y/Y decline last year.
- APAC EBIT dollars declined by 2.9% Y/Y vs. 3.7% Y/Y growth last quarter and a 17.2% Y/Y decline last year.
- Beat $0.52 EPS estimates by $0.18.
- GAAP EPS fell by 26% Y/Y. Its tax rate was 19.6% vs. 12.0% Y/Y. With a 12% tax rate this year, GAAP EPS would have fallen by 18% Y/Y.
Nike told investors that it was “staying disciplined on costs.” Still, demand creation expenses rose 15% Y/Y despite the revenue declines. SG&A overall did fall by 2% Y/Y due to lower overhead expenses via layoffs. GPM expansion was driven by lower product, warehousing and logistics costs. Strategic pricing actions (sacrificing revenue for margin) helped too.
c. Guidance & Valuation
Nike removed most of its annual guidance. I think this was the correct decision. It’s wise to try to get as much bad news out of the way as possible for new leadership. It’s also wise to let a new CEO take their time on perfecting the new plan. Lower the bar for their future success. Previous annual guidance for fiscal year 2025 called for a mid-single digit decline in revenue, 20 bps of GPM expansion and positive SG&A growth. What it did tell us this quarter is that internal expectations have “moderated” since its previous annual guide. It still sees Y/Y revenue declines improving during the 2nd half of the year.
For Q2, it guided to -9% Y/Y revenue growth, which missed estimates by about 2.3%. It also guided to 150 bps of GPM contraction due to more markdowns, wholesale revenue mix, supply chain deleveraging and more. This is materially worse than expected.
d. Balance Sheet
- $10.3 billion in cash & equivalents.
- $9 billion in total debt ($1 billion is current).
- Inventory fell by 5% Y/Y.
- Dividend payments rose 6% Y/Y.
- Diluted share count shrank by 2.7% Y/Y. It has $7.8 billion remaining on its $18 billion buyback program.
e. Call & Release
Some Needed Context:
It’s no secret. Just like countless consumer discretionary brands, Nike has fallen on harder times. Some of that is macro-related and some of it is product assortment and innovation related. There’s also an increasingly popular opinion that Nike’s brand is decaying and slowly dying amid strong competition from Hoka and On Running. If that’s the case, this weakness would likely prove to be structural. If not, it won’t. I’m in the “it won’t” camp. Still, whether the brand is truly losing its shine or not, results are currently ugly and a new CEO has just been named.
He will surely come with a significant pivot in Nike’s current strategic approach, and what that pivot looks like will take time to solidify. This is why Nike removed annual guidance and postponed its investor day. This is a massive company that has, for whatever reason, lost its way. Turnarounds for this type of name don’t manifest overnight. All of this is to say that I don’t really think this quarter matters; Hill doesn’t even start his new job for 10 more days.
“We are reporting our results in a transitional moment, as John retires and Elliott joins as our new President and CEO on October 14th… Elliott is a beloved NIKE veteran who brings a powerful connection to our employees and culture, a deep love for our brands and a passion for sport. Over his [previous] 32 years with Nike, he built a proven track record of leading our global teams, brands and businesses ” – CFO Matthew Friend.
Current (Pre-Hill) Turnaround Plan:
Nike has been “moving aggressively to shift its product portfolio and re-energize the brand’s momentum through sport.” Changes to realize this objective have included the removal of several middle management layers to accelerate pace of innovation. “Speed Lane” is a key piece of this push, which is its new approach to product delivery that aims to shorten time to market through “hyper-localized design and closer work with manufacturing partners.” It has been instrumental in turbo-charging Nike’s launch of sub-$100 shoes and 6 other product lines. The savings pocketed from cutting ties with managers as well as more savings from reduced small parcel fulfillment and other efficiency initiatives will amount to $1 billion for this year. That will be reinvested back into the business.
Beyond organizational restructuring, it expedited the sunsetting of older brands like Dunk and Jordan 1, which, altogether, represent a mid-single digit percentage impact to revenue growth. That headwind will remain in place throughout fiscal year 2025. The most noticeable impact here is on its digital business, where sunsetted franchises delivered -50% Y/Y growth. Wholesale fared much better, which is prompting Nike to shift more of the remaining inventory to that channel. That will be a margin headwind and is another reason why delivering compelling newness is so important: It nurtures direct channel demand to deliver better marketplace balance and operating leverage.
“Partner feedback on our future product pipeline has been very positive.”
CFO Matthew Friend
General Signs of Struggles with Subtle Signs of Progress:
A lot of Nike’s weakness is being driven by lower traffic across its channels. This was most severe for NIKE Direct and digital. Overall, marketplace inventory levels got a bit more bloated Q/Q. This meant “requiring higher levels of promotional activity in Q1 to drive conversion.” Traffic trends did improve month-over-month (M/M) in August, but still missed internal expectations. During the call, Nike also called the “multi-brand environment” very competitive and warned investors that it will “take time to expand market share.” For evidence, its spring 2025 order book results were “lighter than planned.”
There are some subtle green shoots that point to its new innovation resonating. For example, Nike sees new product revenue contribution doubling this year vs. last year. This will help offset some (definitely not all) of the accelerated product sunsetting headwind and other current demand headwinds.
“Comebacks take time. We’ve had some early wins, but have yet to turn the corner.”
CFO Matthew Friend
Performance Demand Trends:
The clearest signs of Nike’s recovery can be seen in its “Performance” segment. It delivered strong growth across men’s fitness and soccer while generating compelling results in men’s and women’s running. Both running segments delivered positive growth and sharp Q/Q improvements (easy comp but still). It just launched its largest running campaign in several years to nurture this momentum. Early consumer reception was called “strong.”
Interestingly, the most notable piece of running strength is “in footwear.” That was a bit of a surprise to me, considering the most legitimate competitive threat for Nike comes from current running shoe vendors. Overall revenue from new performance shoes rose by double digits Y/Y. Furthermore, the spring 2025 order book points to 10%+ Y/Y unit growth for the year. That likely doesn’t mean 10%+ Y/Y revenue growth, as new introductions of cheaper shoes will likely mean unit growth leads revenue growth.
“Running has been one of our toughest fights over the past few years and is one of our biggest opportunities. We are focused on driving a comeback here.” – CFO Matthew Friend
Running Innovation Coming Soon:
- New “max cushioning system” to “blend comfort and style.”
- Running apparel refresh with more focus on “women-led designs.”
- New trail-running models.
- The aforementioned debut of sub-$100 shoes to cater to somewhat fragile macro and consumer anxiety.
“As we look to the spring, newness and innovation for footwear will take a step forward with growth in the mid-to-high single digits Y/Y. We expect to see Q/Q gains in newness and innovation as a percentage of total footwear.”
CFO Matthew Friend
Lifestyle Demand Trends:
This segment continues to struggle. It shrank by more than 10% Y/Y, while Nike “expects declines to continue through the year.” This is for Nike and Jordan. Leadership thinks they need to improve in their ability to react to changing consumer preferences here. The company is currently prioritizing full price sales to “protect the long term value” of the brand, which is amplifying revenue declines for this segment.
More on China:
Retail sales in China “moderated” for Nike and the industry. It “was not immune,” as the firm saw sharper traffic declines than expected, lower conversion rates, bloated inventory and more promotional pressures. It remains the top sports brand there and also remains confident in the long-term opportunity while expecting near-term weakness to endure.