Table of Contents
- 1. Robinhood (HOOD) – Earnings Review
- 2. Super Micro Computer (SMCI) – Earnings Summary
- 3. Earnings Round-Up – Axon, JFrog & ELF
- 4. Celsius (CELH) – Nielsen Data
- 5. Progyny (PGNY) – Final Thoughts on Earnings
- 6. Amazon (AMZN) – TikTok and Pinterest
- 7. SoFi (SOFI) – Mortgages & Galileo
- 8. Starbucks (SBUX) — Another Activist
- 9. SentinelOne (S) – Alphabet & Product Debuts
- 10. Market Headlines
- 11. Macro Data
1. Robinhood (HOOD) – Earnings Review
a. Demand
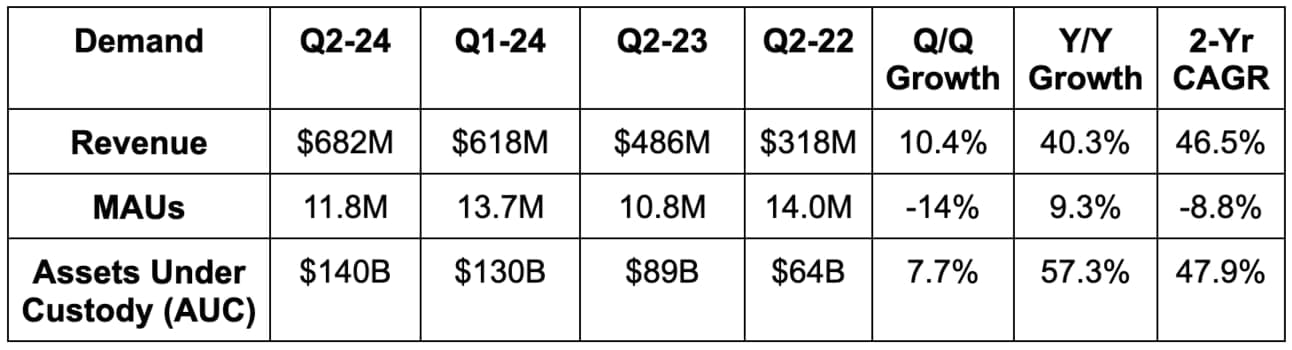
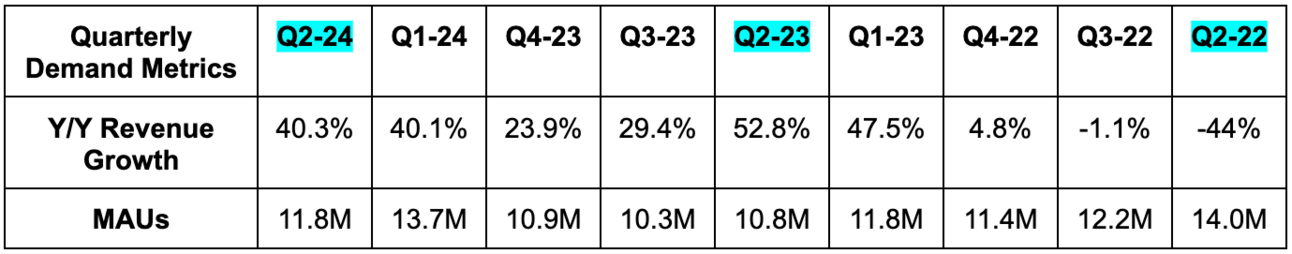
- Beat revenue estimate by 6%.
- Missed monthly active user (MAU) estimate by 9.2%.
- Average revenue per user was $113 vs. $104 Q/Q & $81 2 quarters ago.
- Robinhood Gold subscribers rose 61% Y/Y to cross 2 million.
b. Profits & Margins
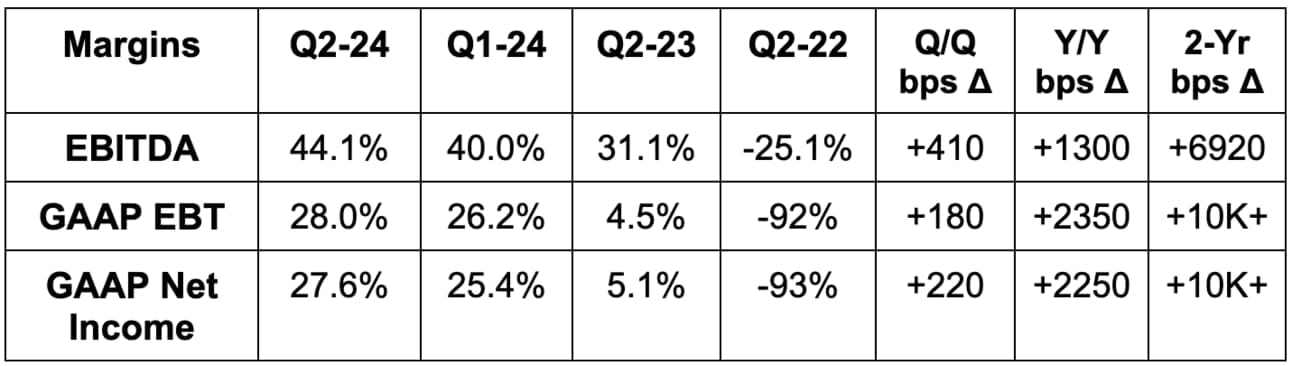
- Beat $0.15 GAAP EPS estimate by $0.06.
- Beat EBITDA estimate by 15%.
c. Balance Sheet
- $33 billion in trailing 12-month deposits vs. $24B last quarter and $17.3 billion 2 quarters ago.
- $4.5 billion in cash & equivalents.
- No traditional debt.
- Diluted share count fell 1.8% Y/Y. New $1 billion buyback to be spent over the next 2-3 years, barring aggressive market volatility.
d. Guidance & Valuation
Robinhood reiterated $1.9 billion operating expense (OpEx) guidance for the year. This is despite two smaller acquisitions of a crypto exchange and an AI-powered equity research firm during the quarter. Formal guidance is not provided, but it did offer commentary on July and August volumes. July trading volumes were 20% higher than during June. As of its quarterly report, August volume was consistent with July.
CFO Jason Warnick did tell us that Robinhood has a “strong track record” of 20%+ revenue growth. He’s right, but that’s looking at several years. Brokerages are cyclical, and while market share gains and product diversification do buffer that cyclicality, it’s not immune. For context, revenues fell 25% Y/Y in 2022. The bear/bull debate centers on this issue. Is this just a brokerage with a superior interface? Or a budding financial services super-app bucking the volatility? I see it as a brokerage, but this year has still been very impressive.
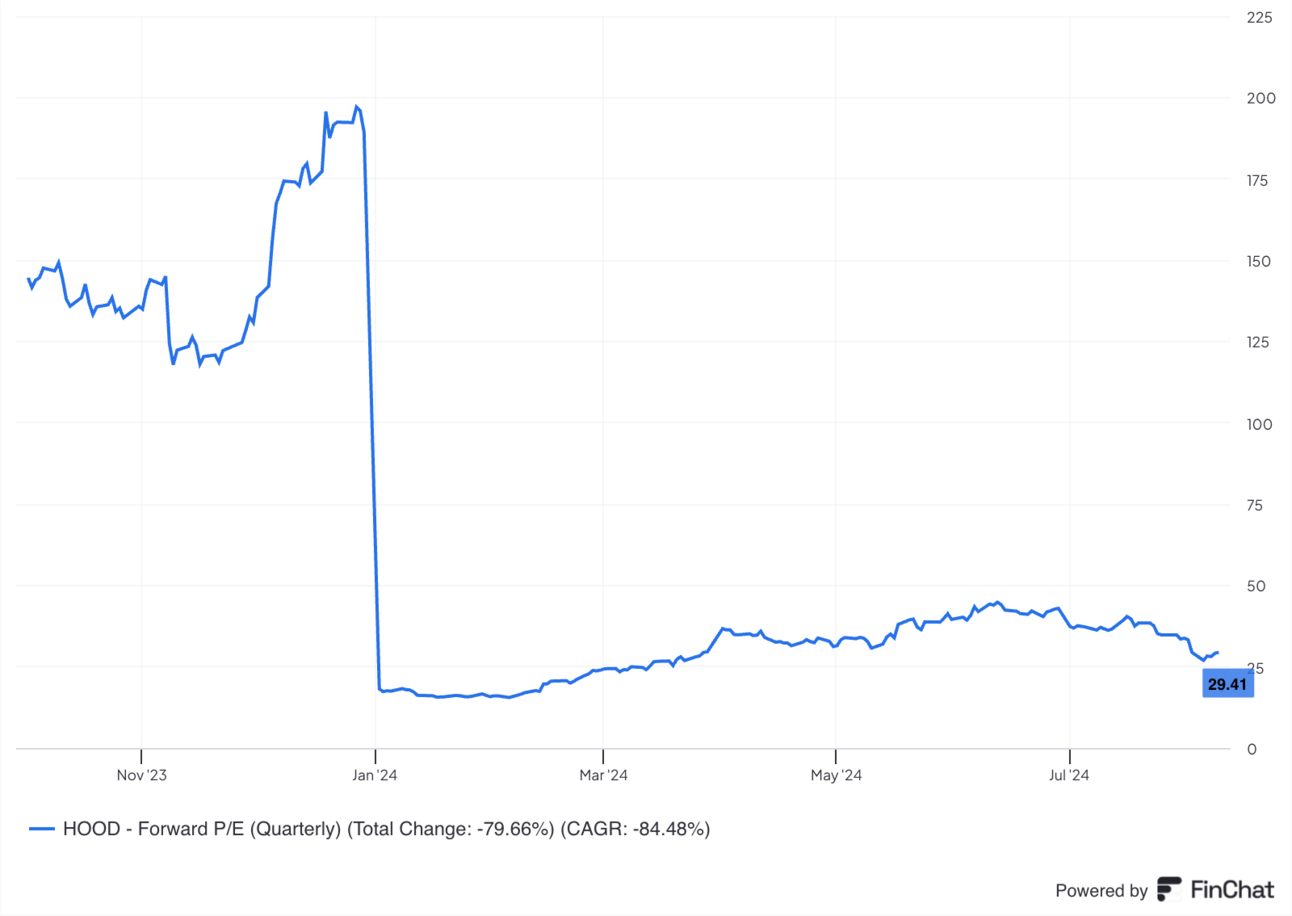
Robinhood trades for 19× 2024 earnings. EPS is expected to grow by 94% Y/Y next year and by 1% Y/Y in 2025. Note that the sharp decline in forward p/e shown below is because Robinhood was rapidly inflecting to positive GAAP net income.
e. Call, Slide Deck & Press Release
Transaction Revenue:
Transaction revenue growth was 69% Y/Y, driven by 43% options growth, 161% crypto growth and 60% equity growth. On a sequential basis, this category was flat as crypto volume declines offset growth in other buckets. It added 300,000 funded accounts (2nd largest Q/Q net adds in the last year) to reach 24.2 million. A 1% deposit bonus for Gold members helped drive an added $3 billion in asset transfers, which directly supports overall transaction revenue.
Robinhood sees revenues from margin lending (those leveraging their equities to borrow and buy more) as a massive near-term opportunity. Incumbents collect more revenue from lending than they do from trading. The company previously did not feel like its margin rates or the offering overall were competitive. So? It debuted industry-leading 5.7% margin rates and saw the margin book spike 52% Y/Y. 75% of these accounts have balances over $100,000.
In its pursuit of “winning the active trader” there are a few more product gaps that it needs to close vs. the E*Trades of the world. It has done a lot with futures recently, but does need to enhance index options, fixed income offerings and add products like CDs. That’s the plan. While its active trader product category is the most mature, it sees a lot of product innovation and growth left in the tank. Robinhood will host an October event for these active traders to unveil some of this work. They hinted at a new desktop version coming out with more advanced charting tools, which would be another important product gap to close.
- Equity volumes rose 57% Y/Y.
- Options contract volume rose 38% Y/Y.
- Crypto volume rose 137% Y/Y. Crypto take rates continue to rise.
- Added 170,000 retirement accounts Q/Q for its fastest rate in a year. It now has 820,000 total retirement accounts.
- It already reached its net deposit goal for the year.
Net Interest Revenue:
Net interest revenue rose 22% Y/Y to $285 million thanks to growth in interest earning assets, more margin issuing and higher rates. This continued to grow sequentially, as its newly issued industry-leading margin rates helped drive more momentum along with growth in securities lending and carrying larger interest-earning asset balances.
Falling rates will pressure this bucket to a certain extent, but Robinhood has important offsets. Most of its interest-earning liabilities held on the balance sheet are for its 5% cash yield. As rates fall, it will cut that yield to counteract the net interest margin pressure. Still, a quarter point rate cut represents about a $10 million (or 3.5% of total) quarterly revenue headwind.
Other Revenue/Robinhood Gold:
Other revenue growth was 19% Y/Y due mainly to more Robinhood Gold subscription revenue. Gold members (I need to rewatch Austin Powers) rose 61% Y/Y, while subscription revenue crossed an annualized run rate of $100 million.
Impressively, 8.2% of funded accounts are now gold subscribers vs. 7% Q/Q. That was its largest sequential jump in well over a year. Its 5% cash yield, 3% IRA match, 1% deposit match and now 3% cash back credit card are all driving this success. Robinhood has deeply enhanced the value of this subscription lately, and so was understandably asked about price hikes. That’s not the current focus. It’s pushing to drive more adoption and could revisit price hikes down the road.
The Robinhood Gold credit card and related perks are expected to keep growth here humming… but what about the margin profile attached to this growth. After all, 3% cash back doles out Robinhood’s entire interchange cut. 1% deposit matches and a 5% cash yield without a banking charter are all expensive perks. So how do they expect to make money on this?
They bank on a large deposit halo effect. Customers are delighted by the value, they move more of their financial service business to Robinhood, and it comes out ahead. That is their point of view. Specifically, Gold members are delivering a 7x revenue lift and ROI gains. So this is working well for now. All I will say is that the brokerage environment will be tougher at some point and credit card losses can mount in a hurry. Recognizing this, they’ve gone very slowly with issuing new credit cards… which I think is the responsible decision. Good for them forgoing near-term revenue to ensure underwriting algorithms and unit economics are favorable. Smart.
Costs:
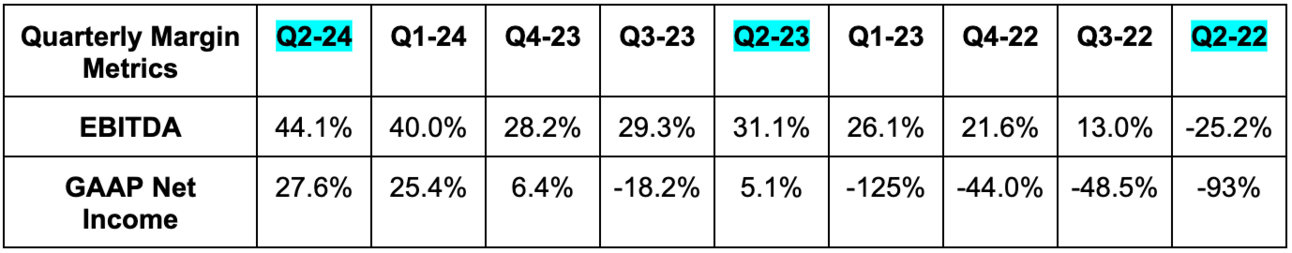
GAAP operating expenses (OpEx) rose by just 6% Y/Y thanks to lower stock comp and leverage in other cost categories too. Non-GAAP OpEx rose 14% Y/Y. The team’s incremental EBITDA margin sat at a lofty 77% for this quarter and it’s already at its old 40% EBITDA margin target. Incumbent brokers typically operate at 50% EBITDA margins, and Robinhood sees itself getting there. At the same time, it does not see 50% as the final destination, but a step on its journey. 90% of its costs are fixed and it does not have the same expense base that legacy incumbents have. They should be able to do better than 50%.
24-Hour Market Outage Earlier This Week:
The 24-hour market outage from earlier this week wasn’t Robinhood’s fault. Blue Ocean (3rd party vendor) was struggling with the excess demand and so it had to be shut down. Leadership reminded us how new this product is and how it will continue to perfect processes and lead the charge. I think 24-hour markets invite market manipulation and unhealthy moves that push retail to capitulate at the worst times (see last Monday). Still, if this is legal, there’s no reason for Robinhood not to pursue this added volume opportunity. It allows them to stand out from the pack as they can rightfully claim more market access than others.
f. Take
This was a rock-solid quarter for Robinhood. Tailwinds were in place, and they took advantage. I’m truly fascinated by the polarization of this investment case. I can see a world where growth turns negative amid the next nasty phase of the brokerage cycle when they aren’t enjoying so many successful launches and programs. I can see how the credit card could lead to balance sheet and loss ratio issues down the road. At the same time, these guys are killing it in the market share-taking game. They are standing out wherever they can on the product side and they are delivering great results today. I think bulls should be pleased and bears should be feeling a bit more anxious. Rate cuts are coming, and the volume gains stemming from those cuts should outpace the net interest income headwinds that coincide. Retail mania marches on.
2. Super Micro Computer (SMCI) – Earnings Summary
a. Demand
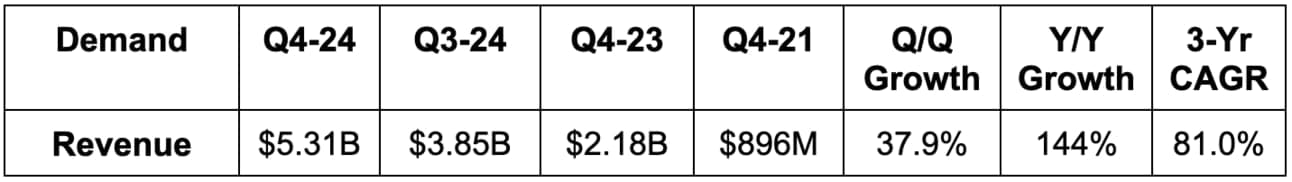
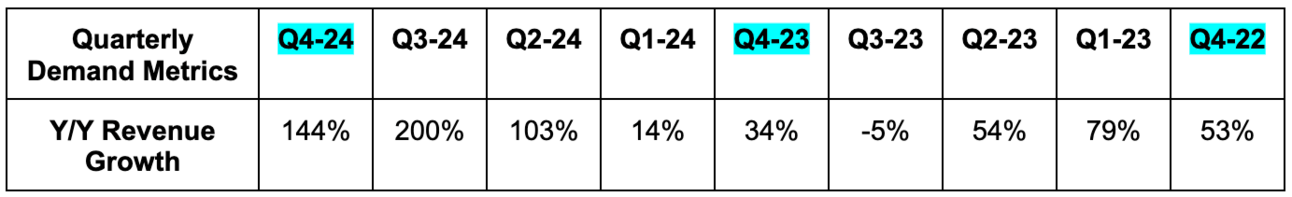
SMCI met revenue estimates & its identical guidance. Its 81% 3-year revenue CAGR compares to 63% Q/Q & 41% 2 quarters ago. $800 million in revenue was delayed to next quarter due to capacity constraints.
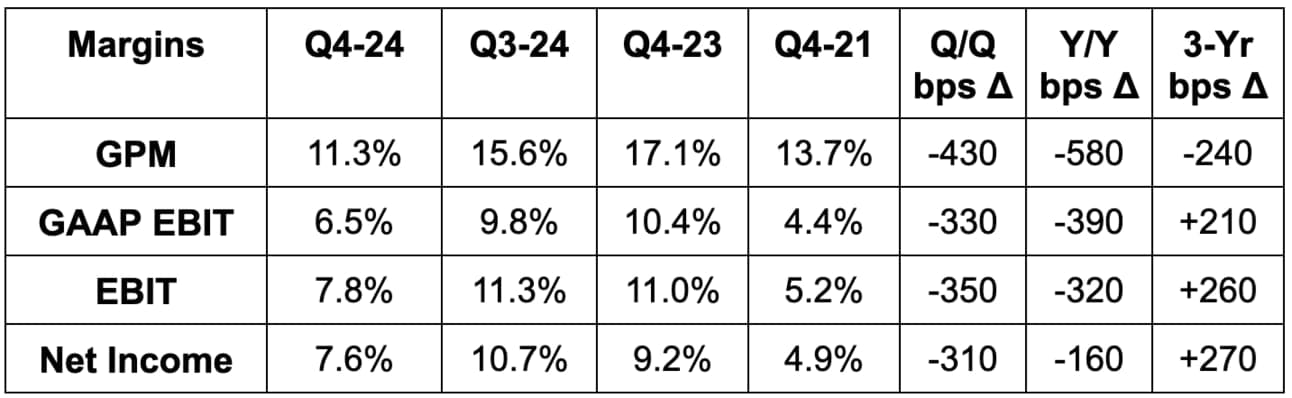
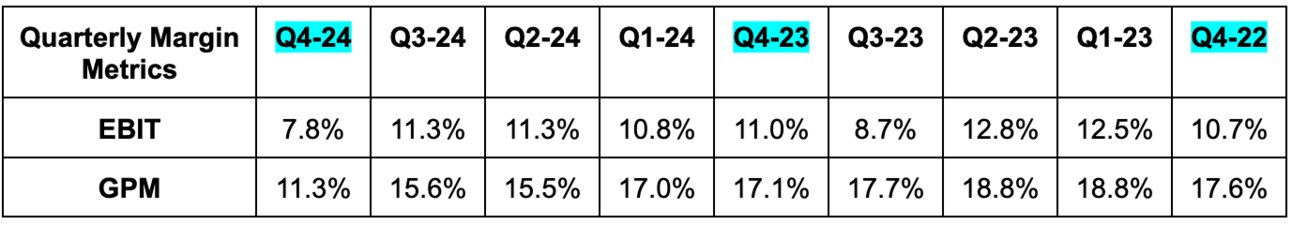
b. Profits & Margins
- Gross profit margin (GPM) materially missed estimates.
- Missed $7.81 GAAP EPS estimate by $2.30 & missed guide by $2.12.
- Missed $8.14 EPS estimate by $1.89 & missed guide by $1.77.
c. Balance Sheet
- $1.67B in cash and equivalents.
- $4.4B in inventory vs. $1.4B Y/Y.
- $1.7B in convertible notes.
- $475M in term loans.
- Basic share count rose 11% Y/Y (raised equity in March).
- Announces 10-1 stock split.
d. Guidance & Valuation
- Annual revenue estimate beat by 19.7%
- Q1 revenue guidance beat by 19%.
- Q1 EPS guidance Missed $7.58 estimates by $0.10.
- Q1 GAAP EPS guidance beat $6.60 estimates by $0.22.
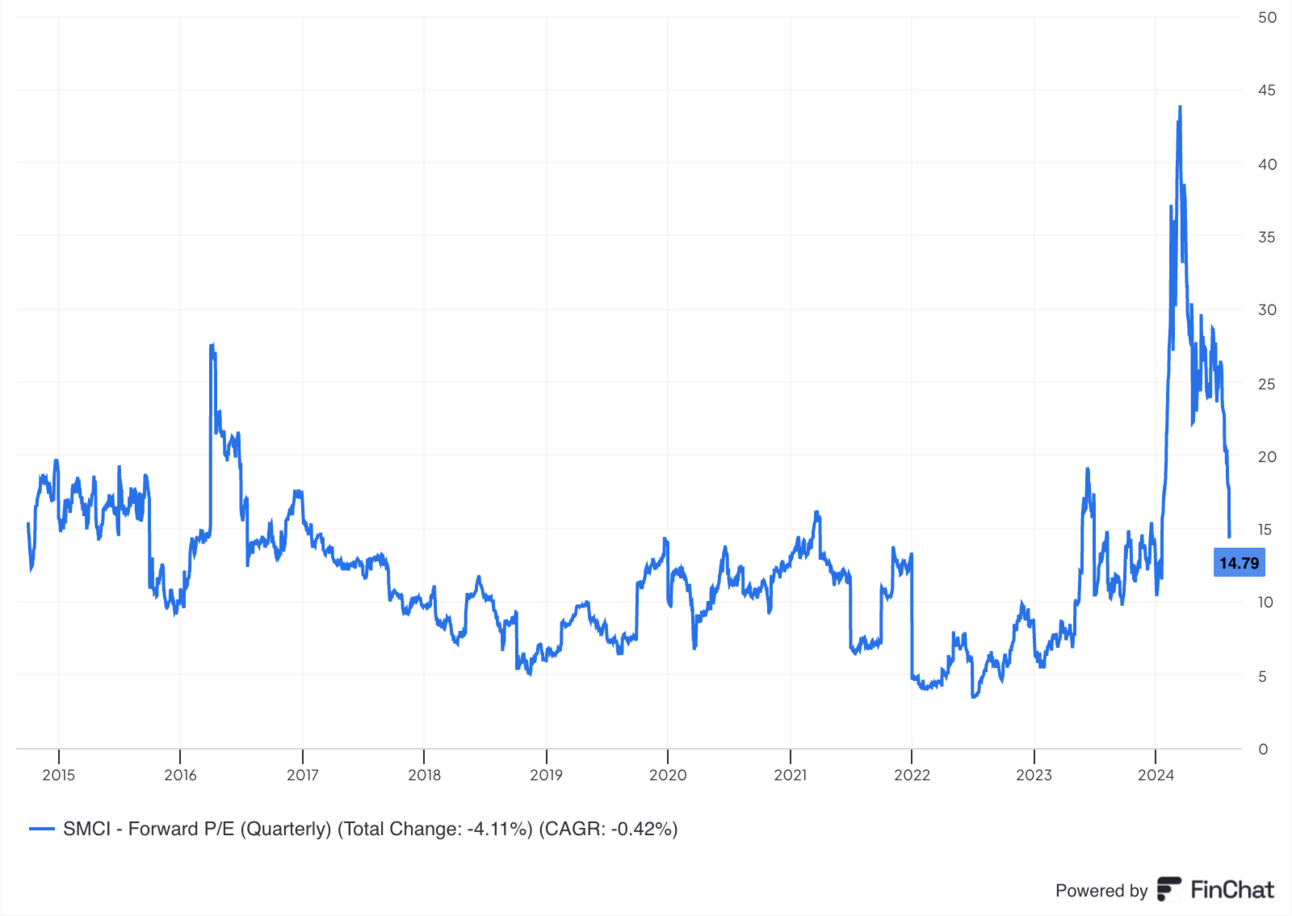
SMCI trades for 15x next year’s earnings. EPS is expected to grow by 56% Y/Y next year and by 30% Y/Y the year after. Considering the cyclical nature of this business model, I don’t think EPS growth estimates are all that valuable. They will violently swing as cycles unfold.
e. Summarizing the Strange SMCI Quarter
The entire call was spent on margin trends and expectations amid the large revenue beat paired with an EPS miss. This stirred up a renewed bull/bear debate, which we will focus on here.
Direct Liquid Cooling Supply Chain:
Margin pressure was split evenly between two items: Direct Liquid data center Cooling (DLC) demand and revenue mix shift. Starting with DLC demand, the strong momentum is not surprising. The capacity arms race is not ending, and SMCI hardware is a key piece of AI data centers. Its DLC technology cuts energy usage by 40%, boosts data center performance and uptime, and lowers carbon footprint. Its new data center building block solution (DCBBS) also reduces data center build time from 3 years to 2 years. That’s compelling, as large caps race to build capacity. Simply put, DLC “dramatically improves total cost of ownership” vs. air-cooled systems and should therefore continue to see adoption rates rise.
Demand levels for liquid-cooled racks surprised the team. It responded to this demand by quickly ramping the supply chain and “paid a lot of expedited cost” to support this. That weighed heavily on margins, but should be temporary. Capacity at its new Malaysia factory, expansion projects in the USA and more time to build capacity in an efficient manner are all expected to erode this margin headwind over time. The company sees a clear path back to a 14% - 17% gross margin.
SMCI sees its DLC tech as industry-leading and it’s choosing to spend more on expediting supply to capture market share gains. Players like Nvidia are trying hard to compete here, so securing demand today does make some sense. This decision fostered a roughly 75% market share of liquid cooling deployments this past quarter. It will ramp rack production capacity from 1,000/month to 3,000/month by 2025. It’s also now extending its easily-deployed DLC rack solutions to next-gen AI data centers, which should simply build on this product’s strong cyclical momentum.
“Now we are further expanding this solution to the entire data center, with rapid deployment of large-scale AI infrastructure.”
Founder/CEO Charles Liang
Hyperscaler Mix Shift:
The other source of the margin compression was a large order from a hyperscaler, which led to revenue mix shift and some overall pricing pressure. This is the potentially more structural and concerning margin headwind. It points to SMCI perhaps losing some pricing power with larger customers, and needing to concede contractual terms to compete.