Table of Contents
1. SoFi
SoFi is a one-stop-shop for financial services. It aims to provide consumers with excellent products for all major needs and events. It further pushes to delight them to the point of never going anywhere else. That creates key cross-selling and acquisition cost benefits. It also owns its tech stack, has no branches and possesses a bank charter, which all give it the rare ability to combine the cost edges that incumbents and fintechs each enjoy. It also sells its tech stack to customers like H&R Block and Robinhood. My SoFi deep dive can be found here.
a. Demand
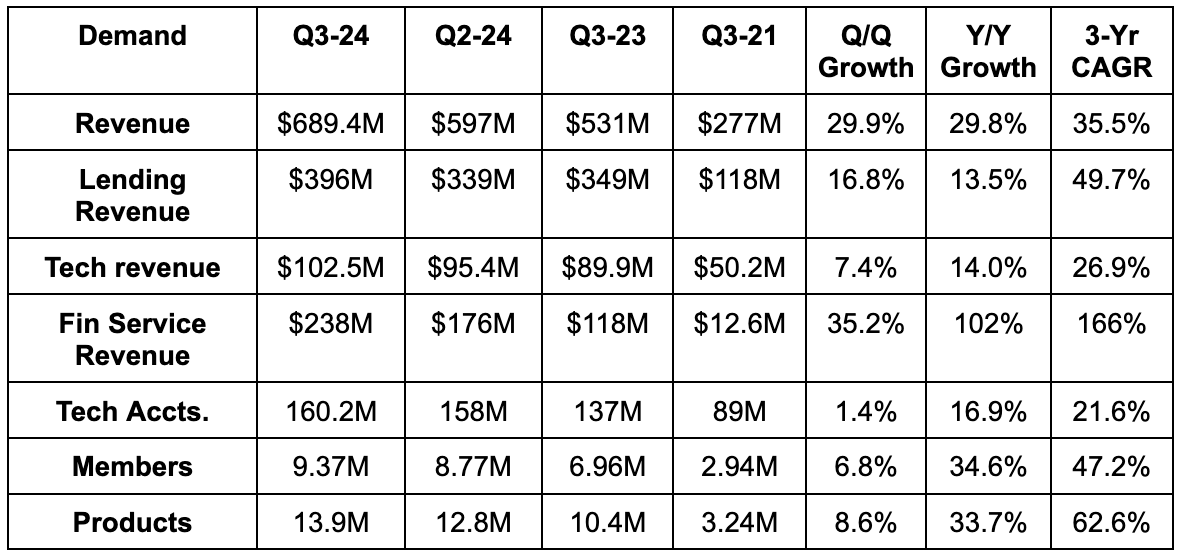
- Beat revenue estimates by 8.6% & beat guidance by 8.5%.
- Lending revenue beat by 19%.
- Tech revenue missed by 3%.
- Financial services revenue beat by 16%.
- Beat member estimates by 1.4%.
- Non-lending revenue (which includes loan referrals) is 49% of total revenue vs. 39% Y/Y. It’s getting more asset-light.
SoFi generated $84.2 million in non interest income from financial services vs. $42 million expected. This is highly important to note. Financial services growth has been powered by balance sheet optimization, or getting more interest income from its existing base of assets. Non-interest income growth, conversely, is separate from this temporary boost and shows you what longer term segment growth can look like. This is the most important metric to gauge whether or not financial service momentum can stay rapid. 230%+ Y/Y growth this quarter tells us that it can. More nuance on this later.


b. Profits & Margins
- Beat EBITDA estimates by 12% & beat EBITDA guidance by 14.6%.
- Beat $0.04 GAAP EPS estimates & beat identical guidance by more than $0.01 each. This represents a 40%+ GAAP net income beat.
- Its 61% lending contribution margin beat 58.6% margin estimates. Its 41.9% financial services contribution margin crushed 34.2% margin estimates. Tech margins were in line.
- Sales & marketing as a percentage of revenue fell by 4 points Y/Y to 31% of revenue. This has been a consistent trend.


c.Guidance & Valuation
- Raised revenue guidance by 3.9%, which beat estimates by 2.8% (Q4 beat).
- The revenue raise was driven by lending.
- Raised EBITDA guidance by 5.3%, which beat estimates by 5.0% (Q4 beat).
- Raised $0.095 GAAP EPS guidance to $0.115, which beat estimates by $0.005 (Q4 beat).
- Raised TBV growth guidance by 14%.
- Reiterated member growth guidance of 30%+ Y/Y.
- Reiterated 2026 revenue and profit targets. “Well on their way.”
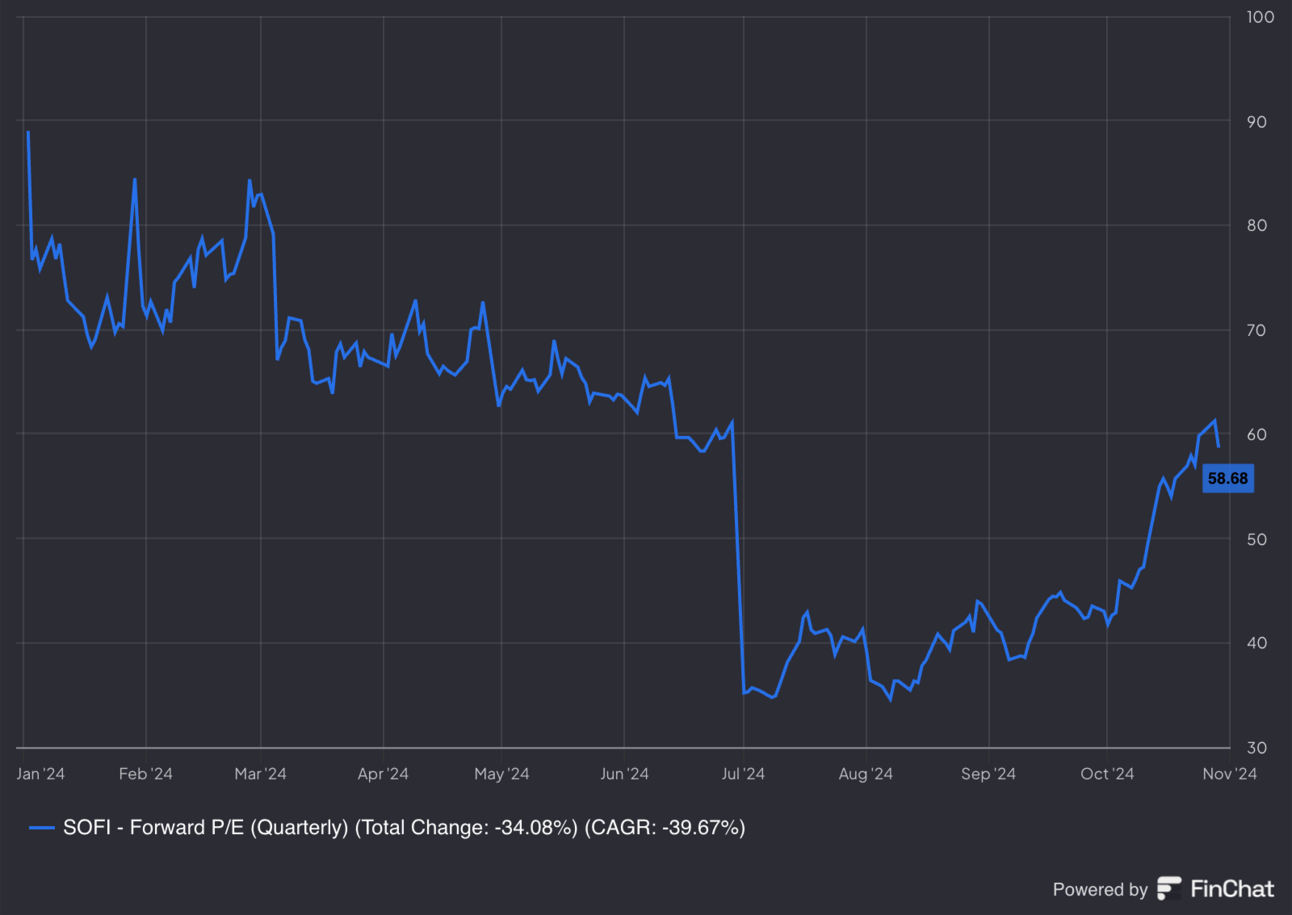
SoFi trades for 61x forward GAAP earnings (probably closer to 50x-55x following revisions). GAAP earnings are set to compound at a triple digit clip through 2026.

d. Balance Sheet
SoFi added $2.4 billion in consumer deposits Q/Q. It added just $1.4 billion in total deposits because it swapped out more brokered CDs to lower its blended cost of capital.

While we have to wait for the quarterly filing for updates to more capital ratios, SoFi did offer total risk-based capital ratio (TCR). It also continues to expect TCR to stay over 16% entering 2025. This compares to a 10.5% regulatory minimum and leaves it with a lot of flexibility.

- $2.3 billion in cash & equivalents.
- $3.2 billion in debt.
- Share dilution remains rapid due to recent capital structure changes. It will slow as stock comp falls under 10% of revenue.
e. Call & Release
“Battle Tested” & Ready to Go:
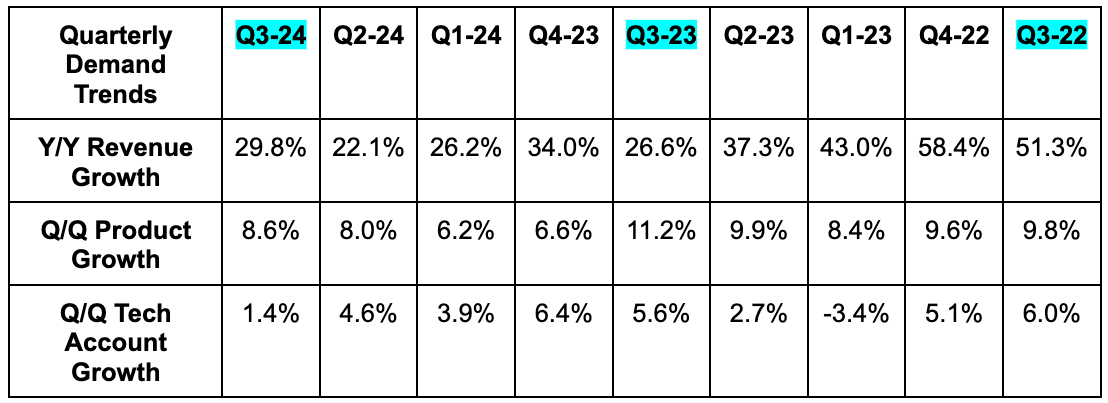
A theme of the call was how “battle tested” SoFi’s business now is. Through a pandemic, a loan moratorium, a historical rate hike cycle and volatile macro (including a regional banking crisis), it has consistently delivered 20%+, margin accretive revenue growth. Noto sees that as crystal clear proof for SoFi having not years, but decades left of strong top line expansion… regardless of backdrop.
For the last several weeks, we’ve dissected how the perfect storm was forming for SoFi to lean back into lending originations and balance sheet growth. Rate cuts have begun to drag down benchmark yields, inflation is coming down, its credit underwriting keeps outperforming, the employment rate is full, broad student loan forgiveness looks unlikely and its capital ratios are well in excess of regulatory minimums. As Noto puts it, 2025 should offer a better exogenous backdrop than SoFi has enjoyed in 7 years. Now it’s time to lean back into the marketing engine… embrace more rapid member growth… and watch the cross-selling engine work its magic like it has for years.
For some early signs of it leaning back into lending:
- Best refinance quarter for home loans since Q2 2022.
- Home equity loan volume rose 44% Y/Y.
- It now sees 2024 lending revenue growth of 0% vs. negative previously.
While it will grow the balance sheet through more lending, it won’t do so rapidly like it did in the past (especially for personal loans). Instead, it will use that as one loan tool in the tool kit, with the loan platform as the other centerpiece. More on this platform later.
Lending – Fair Value & Capital Market Sales:
SoFi bears love to pick on fair value premiums propping up revenue, but that was not the case this quarter. SoFi again hedged away all fair value gains during the period, with the Q/Q premium boosts being irrelevant for overall results.
“The fair value gains in the quarter were significantly more than offset by our hedge losses and the negative impact from spreads widening. Net-net, we did not see a positive impact on the reported revenue from the change in marks, net of hedge losses and new originations.”
CFO Chris Lapointe
But we got even more evidence for fair value markings being entirely fair. First of all, Lending Club boosted its own fair value premiums (and actually pocketed a revenue benefit) due to the same improving assumptions that SoFi cited. Secondly, and more importantly, SoFi executed personal loan sales at a gain on sale margin of 105.9% vs. markings of 105.7%. Furthermore, its 102.6% gain on sale margin for home loan sales was well above most recent markings there. This is capital market buyers with access to the very best data telling you they’ll pay more for SoFi’s loans than marking indicate. All in all, SoFi sold $1.3 billion in loans in total. Notably, it also sold off $312 million in senior secured loans at par value.
“The $312 million transaction demonstrates clear market support for the marks on these loans with $312 million of our senior secured loans sold at our market value.”
CFO Chris Lapointe
“We are well capitalized heading into a better environment.”
CFO Chris Lapointe
Financial Services:
Lending Platform:
SoFi’s overarching loan platform was the standout of this report. I think it’s important to work through how revenue here is accounted for here and the various pieces of this business.
The platform includes rejected borrowers that SoFi matches with investors on its marketplace (called Lantern). If the offers from others are accepted by borrowers, SoFi gets a referral fee, which is financial services revenue. This bucket now also includes loans that the firm originates on a third party’s behalf directly on SoFi’s own site/app. That’s for borrowers within its credit band and outside of it too, as the company pushes to become as asset light as it can be.
It collects both servicing revenue and up-front cash payments for sending this credit to other partners. The servicing revenue is classified as lending revenue, with the cash payments considered financial services revenue (like for referrals). When SoFi originates a loan, holds it on its balance sheet for an extended period of time, then sells to capital markets (like the $1.3 billion mentioned above), that’s all considered lending revenue.
- Notably, there are no loss sharing agreements on these loan platform products.
As briefly mentioned, this is how SoFi can maximize origination growth without taking unwanted balance sheet risk or stressing its capital ratios. This means SoFi gets all of the customer data from borrowers and an easy ability to cross-sell more products. It’s a fantastic way for SoFi to say yes to more people and use lending as a widened top-of-funnel.
This quarter, the loan platform reached $1 billion in total volume originated for others. This represented $56 million in high margin, low risk fees for SoFi’s financial services segment. That result powered a lot of its non-interest growth. The company continues to have excess borrower and capital market demand for its loans and this is how it can best take advantage.
- Also note that of the $1.3 billion in total loan sales this quarter, $375 million were personal loans. That’s lower than previous quarters. That’s related to more 3rd party demand (like from Fortress Capital) being directly funneled through this program.

