In case you missed it, I’ve already sent a Taiwan Semi and Netflix earnings review article and an article outlining my take on the CrowdStrike incident, as well as a new position.
Table of Contents
- 1. Amazon (AMZN) – Prime Day
- 2. Meta (META) – Smart Glasses
- 3. Bank of America (BAC) – Earnings Summary
- 4. Nu (NU) – Competition in Brazil
- 5. American Express (AXP) & Discover Financial Ser …
- 6. Intuitive Surgical (ISRG) – Earnings Snapshot
- 9. Market Headlines:
- 10. Macro Data
1. Amazon (AMZN) – Prime Day
Adobe reported 11% Y/Y growth for Amazon Prime Day for July 16-17. The company reeled in $12.7 billion in sales and set new records across the board. This is good news. Still, just like with Tesla delivery day numbers, we don’t have any margin data associated with this top line number. It’s hard to gauge how intense the promotion levels were, and Amazon has recently cited rising focus on affordability from consumers. Nevertheless, the strong revenue figure was the only piece of good news we could have gotten from the release… and we got it. Thumbs up.
We speak a lot about all of the margin levers that Amazon has to pull and how that should continue leading to more profit upside. Whether it’s robotics, subscription up-sells, 3rd party selling, fulfillment localization etc. this firm has delivered a margin explosion over the last several quarters with no end in sight.
It has done this without perhaps the most powerful margin driver it has: fixed cost leverage. Amazon has a massive fixed cost base between its fulfillment ecosystem for commerce and its data center ecosystem for cloud computing. When industry-wide and Amazon-specific growth slows, Amazon extracts less value from these fixed costs and lower revenue translates to lower profit dollars. While there are certainly variable cost aspects to Amazon’s model (labor, energy etc.), these scale more slowly than potentially outperforming levels of revenue. So? The revenue drivers directly turn into profit drivers to deliver even more impressive results. 11% Y/Y growth for this highly important day points to e-commerce growth bottoming; AWS’s last quarter points to cloud computing growth bottoming too. More profit tailwinds.
2. Meta (META) – Smart Glasses
Meta is exploring taking a $5 billion stake in RayBan maker EssilorLuxottica. This comes after we’ve heard leadership speak on raising production levels due to strong demand. While heavy Quest or VisionPro headsets just aren’t comfortable or useful enough for broad adoption, this more simple iteration of augmented reality hardware is working. And that tells you exactly what consumers want.
The Quest and VisionPro headsets are big, heavy, sweaty and weird-looking. Go to the Apple Store and try one out for yourself. The RayBan glasses are light, subtle and stylish. They can do significantly less than the full headsets, but consumers don’t seem to mind. They want something they can comfortably wear all day, without getting strange looks from colleagues or strangers. Want more evidence? Apple is probably going to fall 600,000-700,000 units short of its 800,000 unit 2024 VisionPro sales target. That says it all.
To drive ubiquity here and make these headsets the next computing form factor, they’ll need to be as or more powerful as they are today AND as slick as the RayBan glasses. We are several iterations away from miniaturizing the technology enough to bring that reality to life. When it happens, I still think Quest will have the last laugh and turn into a valuable profit driver for Meta. It will give Meta the developer and consumer traction needed to build out a giant app store and monetize that software down the road. That’s how I see this playing out, with plenty of heckling from now to then on how poorly Meta’s (and Apple’s) headsets are translating into financial success. Quest will be an irrelevant cash incinerator until it suddenly isn’t. I think that will be because it finds product market fit rather than because Meta threw in the towel. We shall see.
3. Bank of America (BAC) – Earnings Summary
a. Results
Demand Metrics:
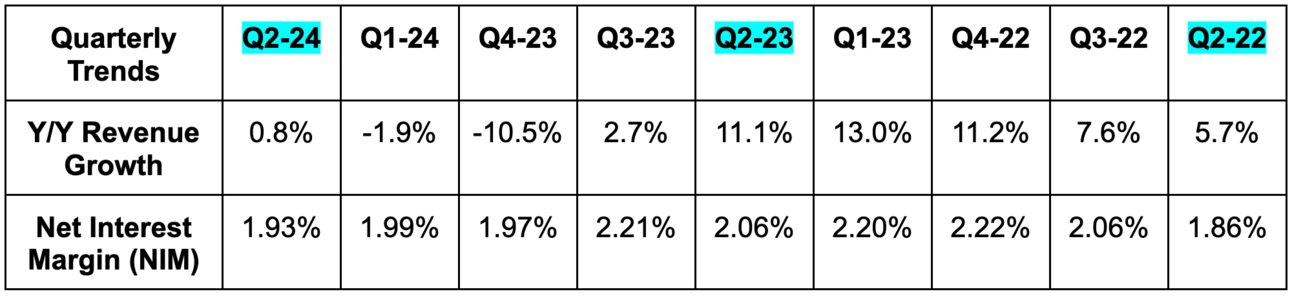
Bank of America beat revenue estimates by 0.8%. Growth in non-interest fee income helped offset the expected Q2 net interest income (NII) weakness. Specifically, 6% Y/Y fee growth was led by 14% Y/Y growth in asset management fees and 29% Y/Y growth in investment banking fees (very easy comp). NII fell 3% Y/Y to $13.7 billion as higher deposit costs more than offset higher asset yields. (I guess they were only paying me a 0.00000001% savings yield).
Average deposits for the overall corporation rose from $1.875 trillion to $1.910 trillion Y/Y due to global banking deposit growth. This growth offset consumer banking and global wealth management deposit softness. Loans and leases rose ever so slightly Y/Y.
Profit & Return Metrics:
- Missed $0.80 GAAP EPS estimates by $0.04. GAAP EPS fell a bit Y/Y due to 2% growth in non-interest expenses leading revenue growth.
- Beat $0.80 EPS estimates by $0.03. Non-GAAP EPS excludes a $0.07 impact from FDIC accruals. With this adjustment, EPS was flat Y/Y.
- Book value per share rose 7% Y/Y to $34.39 and beat $34.25 expectations.
- 10.0% return on equity (ROE) beat 9.6% estimates.
- 0.85% return on assets (ROA) beat 0.82% estimates by 3 bps (basis points; 1 basis point = 0.01%).
- Please note that BofA’s 11.9% standard common equity tier 1 (CET1) ratio compares to a 10.7% regulatory minimum that will be implemented in October.


b. Guidance & Valuation
BofA reiterated expectations of Q2 being the low point for NII. It sees NII rising in Q3 and again in Q4. This guide is based on expectations of (still) 3 rate cuts and 5.0% unemployment by the end of the year.
c. Balance Sheet
- Total global liquidity is $909 billion.
- Paid $0.24 per share in dividends vs. $0.22 Y/Y. Pending board approval, BofA’s dividend will rise to $0.26 per share next quarter.
- Diluted share count fell 1.5% Y/Y.
Bank of America continues to successfully shift long-dated held-to-maturity assets to higher-yielding, short-dated assets. This diminishes the risk of pent-up losses stemming from rate volatility like some banks have experienced during this cycle. BofA is earning 160 bps more in yield on cash than it’s paying out in deposits.
d. Consumer, Commercial & Overall Credit Highlights
Overall Credit Health:
Overall provisions for credit losses provide an estimate of future credit losses. Overall net charge-off (NCO) measures the credit losses that Bank of America is actually realizing and accepting as incurred. NCO is more of a lagging indicator compared to provisions and delinquency rates too.
- Provisions were $1.5 billion vs. $1.3 billion Q/Q and $1.1 billion Y/Y. BofA released $25 million in net credit reserves vs. building $256 million in reserves in Q2 2023. This marks its 3rd consecutive quarter of credit reserve releases as it sees signs of improving macro.
- NCO rate was 0.59% vs. 0.58% Q/Q and 0.33% Y/Y.
- Overall non-performing loan (NPL) ratio was 0.52% vs. 0.56% Q/Q and 0.39% Y/Y.
- Allowance for loan and lease loss ratio was 1.26% vs. 1.26% Q/Q & 1.24% Y/Y.
Consumer Credit Health:
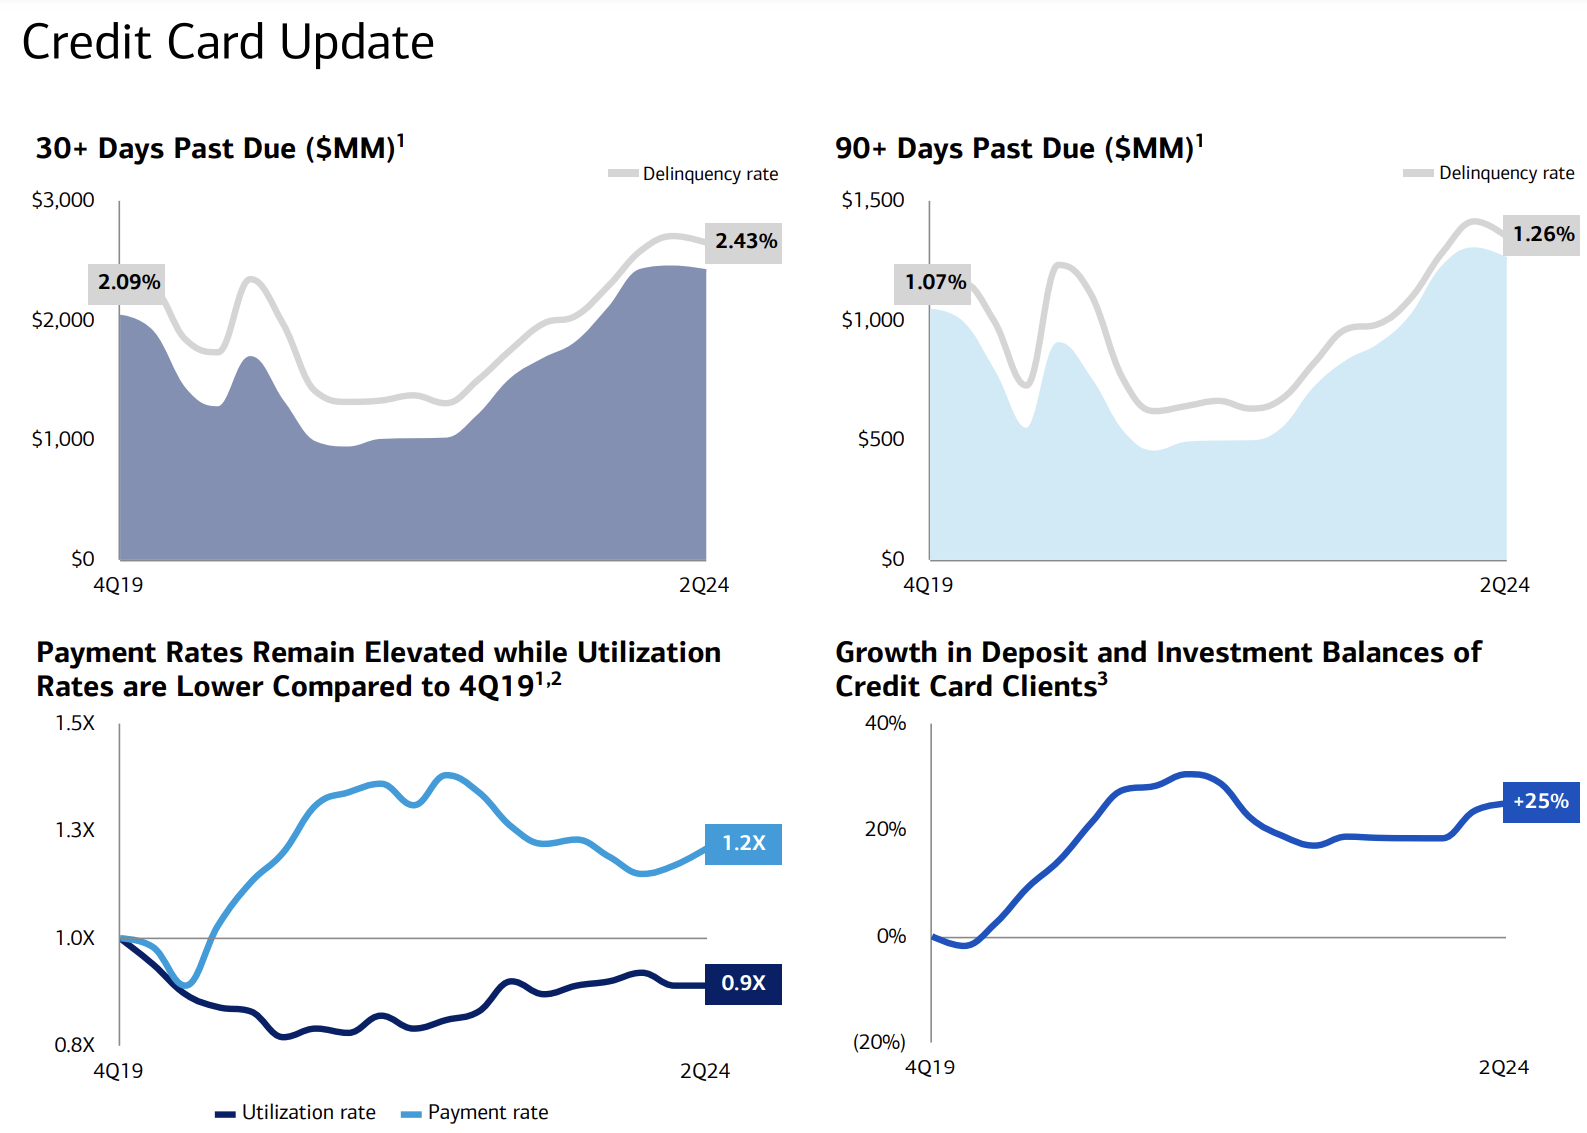
Consumer provisions totaled $1.09 billion vs. $959 million Q/Q and $1.10 billion Y/Y. Consumer NCOs totaled $1.06 billion vs. $1.03 billion Q/Q and $720 million Y/Y. The Y/Y rise was powered by continued credit normalization and worsening macro. The modest Q/Q rise specifically was due to the credit card loss rate rising from 3.62% to 3.88%.
90+ day delinquent consumer credit totaled $1.47 billion vs. $1.53 billion Q/Q and $1.19 billion Y/Y. Bank of America continues to enjoy credit repayment rates above 2019 levels, a stabilization in consumer 30-and-90-day credit card delinquency rates and no tweaks to its annual macro forecast. This should eventually power a clear peak in NCOs and actual credit losses. That’s what it expects.
- Consumer NCO rate was 0.93% vs. 0.91% Q/Q and 0.64% Y/Y.
- Consumer allowance for loans and leases as a % of total was 1.86% vs. 1.87% Q/Q and 1.70% Y/Y.
- Consumer NPL rate was 0.58% vs. 0.59% Q/Q and 0.60% Y/Y. Good to see that falling (even if the change is small).
“Many of you have asked about consumer NCOs and when they would stabilize. Our expectations there remain unchanged… this quarter [marked] a stabilization of that rate.”
CEO Brian Moynihan
Commercial Credit Health:
Commercial provisions totaled $414 million vs. $360 million Q/Q and $25 million Y/Y. Commercial NCOs totaled $474 million vs. $470 million Q/Q and $149 million Y/Y. The Y/Y rise was due to rising commercial real estate (CRE) and small business losses (worsening Y/Y macro). For CRE specifically, the firm “continues to aggressively work through loans in this portfolio. It enjoyed falling NPL and NCO rates within the category on a Q/Q basis and continues to see NCOs for CRE falling throughout 2024.
- Commercial NCO rate was 0.32% vs. 0.32% Q/Q and 0.10% Y/Y.
- Commercial NPL rate was 0.47% vs. 0.54% Q/Q and 0.24% Y/Y.
- Commercial allowance for loans and leases as a % of total was 0.79% vs. 0.80% Q/Q and 0.88% Y/Y.
Consumer Banking Metrics:
Consumer credit & debit spending overall rose 3% Y/Y. This is a meaningfully structural metric for gauging consumer health given BofA’s massive U.S. scale. While the segment’s revenue did rise a bit Q/Q, that was driven by more credit card borrowing, which is materially less positive than if growth were driven by more disposable income or more optimistic consumers.
- Consumer banking deposits fell 6% Y/Y; consumer loans & leases rose 2% Y/Y.
- Digital revenue for the segment represents 53% of total vs. 51% Y/Y.
e. Macro Indications/Take
The economic and consumer commentary echoed what we’ve heard from other large cap banks this earnings season. The economy is fine and the consumer is too. But? They’re both slightly less fine than they were a year ago. And consumers are combatting this by borrowing more to fund lifestyles. That fosters a fragility that can turn ugly if economic growth halts or unemployment spikes. Neither of those things look very likely at this point. Slightly less fine economic activity works in this environment as we gear up for monetary accommodation and as unemployment continues to show resilience at a still healthy 4.1%. This bodes somewhat well for the economy overall.
4. Nu (NU) – Competition in Brazil
Thank you to the subscribers who pointed out that I needed to cover the next-gen competitive landscape in more detail in the Nu deep dive. I’ll do that here for Brazil, with a breakdown of the Mexican competitive landscape coming soon. There are incumbents to mention like Itau and others, but the main competitive threat in my mind comes from other fintechs.
Mercado Libre:
The most intimidating, established and well-funded competitor in all of its markets is Mercado Libre. Nu is ahead in terms of product suite depth and credit scale, but MELI has made financial services a key focus area going forward. It just secured needed licensing in Mexico to profitably match Nu’s thriving high yield savings product and is also quite popular in Brazil too. The market is both highly inefficient and massive. That recipe creates immense potential value. In my view, Nu is doing the best job of this, but Meli is impressive too. I candidly see both companies dominating throughout Latin America and think the market share gains will come from the Itau’s of the world rather than each other.
I think the largest differentiator for MELI over NU is MELI’s massive, scaled marketplace. There’s a reason why Nu is trying to build one itself. This marketplace means relationships with more merchants and also greater consumer scale to motivate these merchants to offer exclusive discounts. In turn, customers get unique, delightful value. These commerce tools work quite seamlessly with credit cards and other financial services offered by both. Meli can even offer more exclusive rewards for those paying with its credit product. The utility edge in this specific cross-selling and product suite area goes to MELI.
Inter & Co (INTR):
Inter & Co is a formidable, pure-play competitor for Nu in Brazil. They have the same digitally-native footprint that enables the “say yes to everyone” approach that Nu has for its bank accounts. This allows INTR to enjoy a similarly frictionless top of funnel. They’re both trying to build superapps, with Nu being 11 years old and INTR being 30 years old. Both offer shopping, insurance and investing tools to complement the broad banking offerings. Inter & Co also has a compelling rewards program called Loop, which is delivering the same engagement, personalization and monetization uplifts that Nu’s program yields.
Interestingly, INTR also operates in the USA, which does offer a bit of evidence that Nu’s product suite may resonate in this high value market over time. There is a large, large population of Latin Americans in the states who are underserved by their banks. Go serve them.
Despite the 19 year longer operating history, INTR is a lot smaller, with 31.7 million total customers. Nu has over 100 million, and is enjoying faster rates of customer growth as well. Furthermore, Nu’s customers are far more engaged than INTR, with an 83% active customer rate vs. 55% for INTR. Nu’s quarterly revenue base is about twice the size of INTR with a 64% Y/Y growth rate vs. 37% Y/Y growth for INTR. Next to Nu, these numbers look underwhelming, but that’s a byproduct of how special and impressive Nu truly is. It’s less so due to INTR not being a serious player in the region.
Nu’s risk-adjusted net interest margin (NIM) of 9.7% is more than double INTR’s and its return on equity is also much, much higher. Both have very strong liquidity ratios and large input cost leads over incumbents, with INTR actually claiming to have a slightly lower customer acquisition cost than NU. Still, Nu’s efficiency ratio is more than 1000 bps better than INTR’s.
Both are expanding loan portfolios and PIX financing while delivering strong top line growth with margin expansion. Revenue per customer is similar for both, but when comparing the most mature cohorts for each business, Nu’s is about 50% higher. INTR trades for 17x 2024 earnings with a 2-year forward earnings CAGR of 37% expected. Nu trades for 32x 2024 earnings with a 2-year forward earnings CAGR of 49% expected. Nu’s upward earnings estimate revision trends are sharper than INTR’s.