In Case you Missed It:
- Alphabet Earnings Review
- Tesla Earnings Review
- Chipotle Earnings Review
- ServiceNow Earnings Review
- Netflix and Taiwan Semi Earnings Reviews.
- My Updated Portfolio & Performance with a New Holding
Table of Contents
- a. SoFi 101
- b. Key Points
- c. Demand
- d. Profits & Margins
- e. Credit Health & Balance Sheet Data
- f. Guidance & Valuation
- g. Call & Release
- h. More on Financial Services
- I. Take
a. SoFi 101
SoFi is a one-stop shop for financial services. It aims to provide consumers with excellent products for all major needs and events. It further pushes to delight them to the point of never going anywhere else. That creates key cross-selling and acquisition cost benefits. It also owns its tech stack, has no branches and possesses a bank charter, which all give it the rare ability to combine the cost edges that incumbents and fintechs each enjoy. It also sells its tech stack to customers like H&R Block and Wyndham Hotels. It has a large lending business with an increasingly diverse array of funding options, as well as bank accounts, brokerage services, 3rd-party insurance options, credit cards and so much more.
My SoFi Deep Dive can be found here. This gets into intricate detail on SoFi’s unique value proposition within banking, and everything else you need to know about the firm.
b. Key Points
- Great quarter.
- Strong guidance.
- Continued shift to higher-quality revenue.
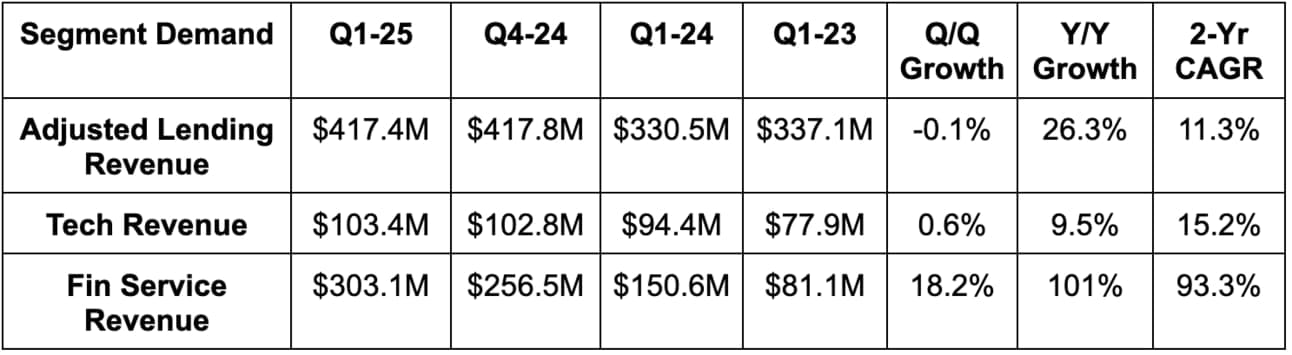
c. Demand
- Beat revenue estimates by 3.9% & beat guidance by 4.8%.
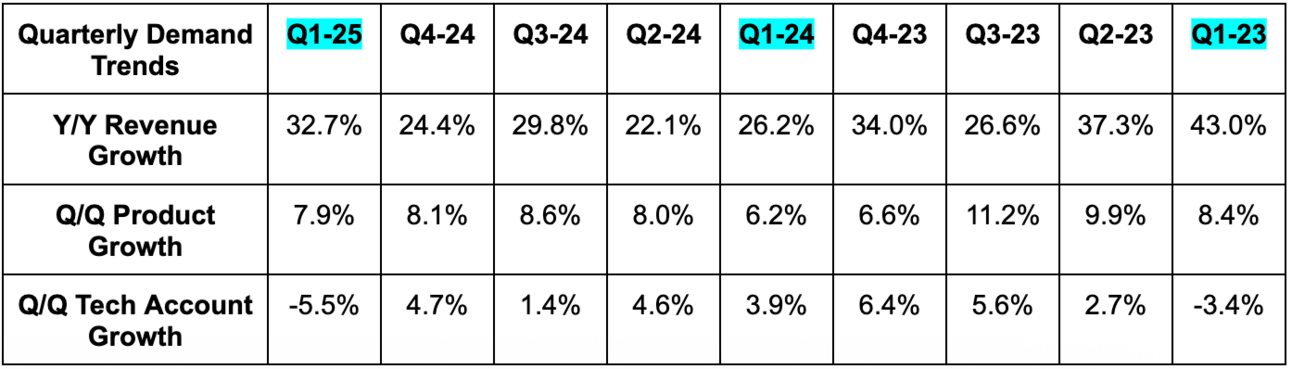
- Fastest rate of growth in over a year.
- Beat member estimates by 3.2%.
- Lending and financial services revenue both comfortably beat estimates.
- Tech platform revenue slightly beat estimates.
- Beat product estimates by 1.4%.
It is great to see product growth moving from trailing member growth on a 2-year basis to matching it in the Y/Y growth column. That shows increasingly healthy engagement for newer members… and that trend is accelerating with slightly faster Q/Q product growth. An incremental 1.5 products added per member Q/Q is a very strong result for this business. As we’ll explore in more detail later on, this is the “better together” cross-selling machine in action.
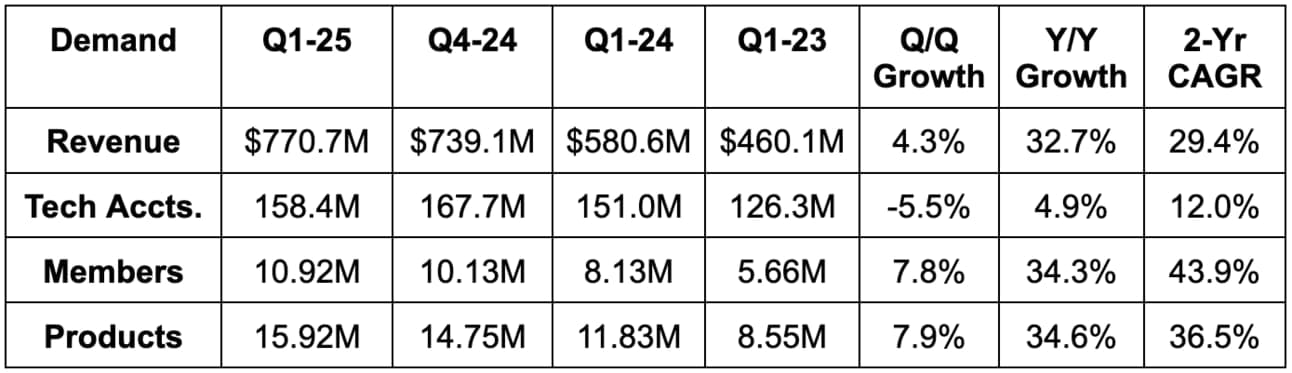
The tech platform Q/Q decline in accounts reflects a client that diversified processing vendors last year. That was already in the 2025 guide and there are no changes to its expectations for that segment for 2025 or 2026.
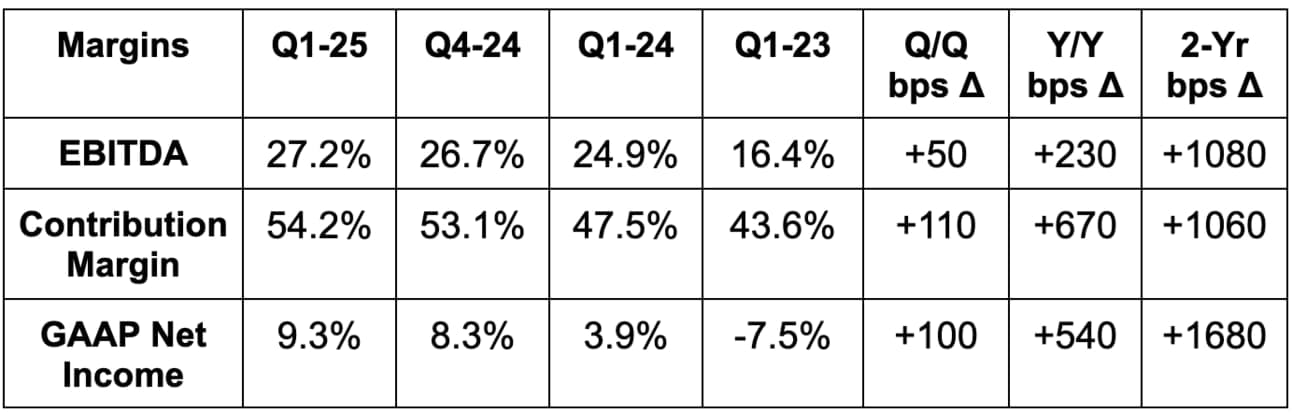
d. Profits & Margins
- Beat EBITDA estimates by 17% & beat guidance by 18%.
- Beat $0.03 GAAP EPS estimates & guidance by $0.03 each. Excluding tax favorability, EPS would have beaten by $0.02 instead of $0.03. As you'll see in the guidance section, it maintained its full-year tax outlook, so that wasn’t the source of the full-year EPS raise.
- Return on tangible common equity (ROTCE) was 5.8% vs. 3.9% in 2024 and -2.8% in 2023.
- Beat 5.81% net interest margin (NIM) estimates by 20 basis points (bps; 1 basis point = 0.01%). That’s a big beat for this metric. More later.